Conditional Probability Tree Diagrams is a Grade 6–8 mathematics worksheet that builds probability and sample-space reasoning through tree diagrams. Across 16 items—15 multiple-choice questions and one multiple-select question—students identify what tree diagrams represent, count outcomes for clothing combinations and die-and-coin experiments, calculate probabilities and complements, and interpret events such as getting a head with an even number. They also analyze repeated draws involving red and blue outcomes and form two-digit numbers with and without repeating digits.
This worksheet helps students connect each branch of a tree diagram to a possible outcome, use counting strategies to determine total possibilities, and distinguish dependent probabilities when an item is not replaced. The final questions reinforce careful enumeration by asking students to identify even two-digit numbers and numbers made from repeated digits. It is a free printable worksheet with a complete answer key, suitable for independent practice, guided review, or a short formative assessment after instruction on tree diagrams and conditional probability.
Worksheet settings
Font size
S
M
L
XL
Worksheets
Conditional Probability Tree Diagrams
Total questions: 16
Name
Class
Date
1.
Tree Diagram
a)
A written list of all possible outcomes
b)
A description of all possible outcomes
c)
A drawing with branches of all possible outcomes
2.
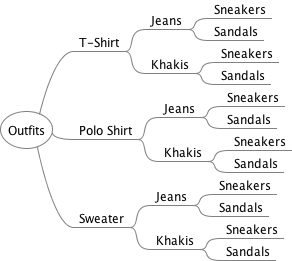
You have a 3 tops, 2 pants and 2 shoes. How many total outfit options are represented?
a)
12 outfits
b)
22 outfits
c)
3 outfits
d)
7 outfits
3.
a)
6
b)
12
c)
2
d)
10
4.
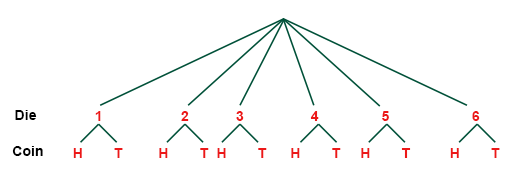
The tree diagram shows the outcomes of rolling a die and flipping a coin. How many total outcomes are there?
a)
6
b)
12
c)
24
d)
36
5.
How many outfits are possible with 5 pairs of jeans, 8 t-shirts, and 2 pairs of shoes?
a)
15
b)
40
c)
80
d)
10
6.
You have a 3 tops, 2 pants and 2 shoes. Pr(wearing T-short)
a)
31
b)
121
c)
71
d)
41
7.
You have a 3 tops, 2 pants and 2 shoes. Event A is wearing a T-short. What is Pr(A')
a)
31
b)
121
c)
32
d)
1211
8.
You have a 3 tops, 2 pants and 2 shoes. What is the possible of you wearing a Polo shirt, with Jeans and sandals?
a)
31
b)
121
c)
31
d)
72
9.
Event B is getting a Head and an event number. How many outcomes for B?
a)
6
b)
3
c)
2
d)
4
10.
Event B is getting a Head and an event number. How many outcomes for B?
a)
6
b)
3
c)
2
d)
4
11.
Explain why the probability of picking a Blue is 96 . The best answer is ....
a)
It's a mistake. It should be 106
b)
You always lose a Blue in the second pick.
c)
You put the Blue back.
d)
You lose a Blue if the first pick is a Blue.
12.
For the third branch, what is the probability of picking a Blue in the second pick?
a)
106
b)
96
c)
107
d)
97
13.
Pr(2 Blues) = ?
a)
107
b)
96
c)
107×96
d)
1−107×96
14.
Pr(at least 1 Red) = ?
(more than 1 answer)
a)
107
b)
96
c)
107×96
d)
1−107×96
e)
107×93+103
15.
Put 1, 2, 3, 4 together randomly to make a 2 digit number.
If you can only use the number once, list all the even numbers.
a)
12, 34
b)
42
c)
12, 14, 24, 32, 34, 42
d)
12, 14, 22, 24, 32, 34, 42, 44
16.
Put 1, 2, 3, 4 together randomly to make a 2 digit number.
If you can use the same number again, what is the probably of getting a number made of the same digit?
a)
0
b)
124
c)
41
d)
121
Answer Key
Conditional Probability Tree Diagrams
Total questions: 16
1.
c) A drawing with branches of all possible outcomes
2.
a)
12 outfits
3.
b) 12
4.
b) 12
5.
c) 80
6.
a)
31
7.
c)
32
8.
b)
121
9.
b)
3
10.
b)
3
11.
d)
You lose a Blue if the first pick is a Blue.
12.
d)
97
13.
c)
107×96
14.
d)
1−107×96
, e)
107×93+103
15.
c)
12, 14, 24, 32, 34, 42
16.
c)
41
140 %
Browse by subjects
Browse by grades
Browse by format
FAQs
What does the Conditional Probability Tree Diagrams worksheet cover?
This Grade 6–8 math worksheet uses 15 multiple-choice items and one multiple-select item to practice reading tree diagrams, counting outcomes, finding probabilities and complements, and reasoning about dependent draws. Students apply these ideas to outfit combinations, die-and-coin outcomes, red and blue draws, and two-digit numbers formed with or without repetition.
How can I use this worksheet to teach conditional probability with tree diagrams?
Introduce the worksheet by modeling how each branch represents a choice and how a complete path represents one outcome, such as combining a die result with a coin flip. Then have students use the outfit and two-digit-number items to practice systematic counting before discussing the probability and complement questions. For the red-and-blue draw items, ask students to explain how not replacing the first selection changes the probability on the next branch.
What mistakes should I watch for when students complete this tree diagram probability worksheet?
Students may confuse a single branch with a complete outcome, add choices when they should count combinations across stages, or omit outcomes when listing even two-digit numbers. Watch for confusion between an event and its complement, especially when finding the probability of not wearing a specified item. In the red-and-blue draw questions, students may incorrectly keep the same second-draw probability after a first item is removed, and they may select only one answer on the multiple-select item.
How do I assign and grade this Conditional Probability Tree Diagrams worksheet?
Wayground provides this worksheet as a printable PDF and as a digital quiz, with a complete answer key for all 16 items. You can assign the digital version for online responses or print the PDF for written work, then grade printable submissions by scanning student work with the Wayground for Teachers app. The printable format can also support classrooms that are reducing screen time.
How can I differentiate this tree diagram and conditional probability worksheet for my students?
Use the worksheet’s Advanced Settings to adjust font spacing or increase the font size so the tree-diagram, outcome-counting, and probability items are easier to follow. You can also enable a dyslexia-friendly font or translate the worksheet into another language, depending on students’ reading needs. These changes apply to the worksheet file while preserving its multiple-choice and multiple-select format.
Where can I find more free worksheets like this on Wayground?
Wayground offers a comprehensive collection of free printable worksheets and practice problems across all subjects, including downloadable PDFs and answer keys to support essential skills and concepts. Browse more resources at https://wayground.com/en-us/worksheets.

 Worksheets