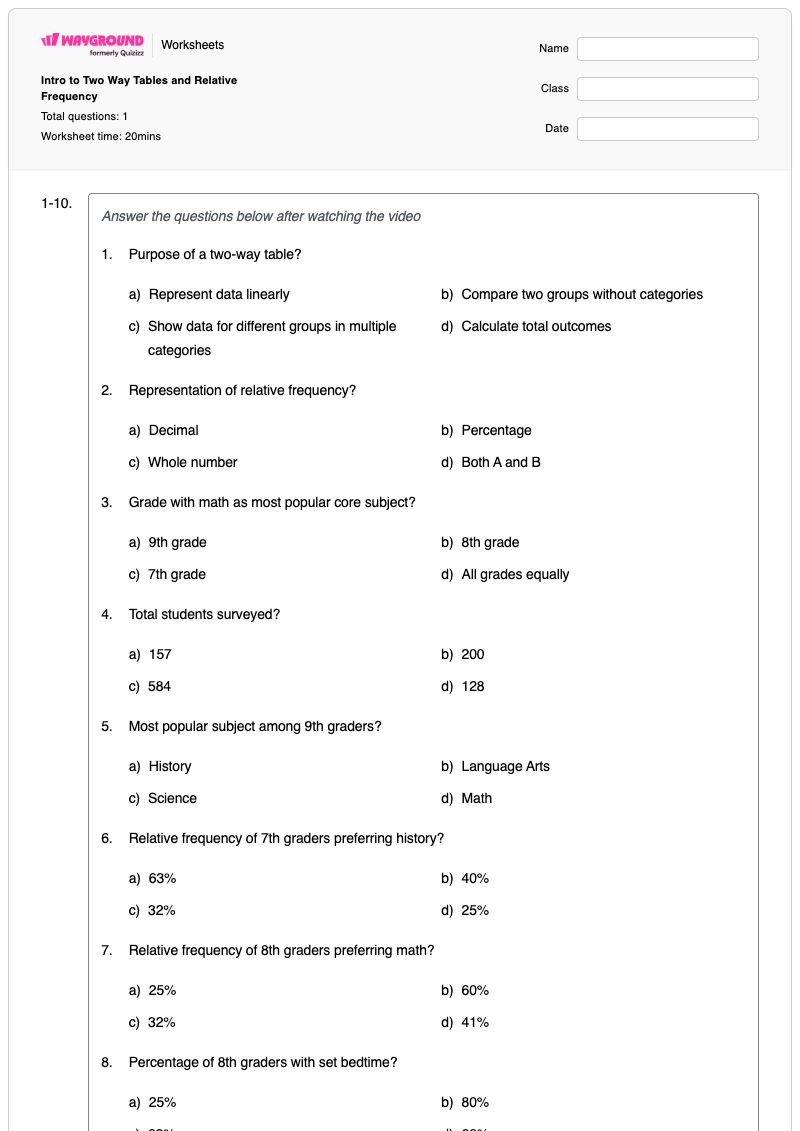
Intro to Two Way Tables and Relative Frequency is a Grade 8 mathematics worksheet that introduces how two-way tables organize data for different groups across multiple categories. Students answer one comprehension video item and 10 multiple-choice questions about identifying a table’s purpose, recognizing relative frequency as a decimal or percentage, reading totals, comparing categories, and interpreting percentages from survey data.
This free printable worksheet with an answer key helps students connect table entries to subgroup totals and use relative frequency to describe patterns. Items ask students to determine the most popular subject for a grade, calculate or identify percentages for preferences and bedtime information, and find a surveyed group’s size. It is suitable for guided instruction, independent practice, or a quick formative check after teaching two-way tables and relative frequency.
Worksheet settings
Font size
S
M
L
XL
Worksheets
Intro to Two Way Tables and Relative Frequency
Total questions: 1
Name
Class
Date
1-10.
Answer the questions below after watching the video
1.
Purpose of a two-way table?
a)
Represent data linearly
b)
Compare two groups without categories
c)
Show data for different groups in multiple categories
d)
Calculate total outcomes
2.
Representation of relative frequency?
a)
Decimal
b)
Percentage
c)
Whole number
d)
Both A and B
3.
Grade with math as most popular core subject?
a)
9th grade
b)
8th grade
c)
7th grade
d)
All grades equally
4.
Total students surveyed?
a)
157
b)
200
c)
584
d)
128
5.
Most popular subject among 9th graders?
a)
History
b)
Language Arts
c)
Science
d)
Math
6.
Relative frequency of 7th graders preferring history?
a)
63%
b)
40%
c)
32%
d)
25%
7.
Relative frequency of 8th graders preferring math?
a)
25%
b)
60%
c)
32%
d)
41%
8.
Percentage of 8th graders with set bedtime?
a)
25%
b)
80%
c)
63%
d)
60%
9.
Among no curfew students, % without set bedtime?
a)
40%
b)
20%
c)
60%
d)
80%
10.
Number of 8th graders surveyed on curfews and bedtimes?
a)
25
b)
16
c)
40
d)
24
Answer Key
Intro to Two Way Tables and Relative Frequency
Total questions: 1
1-10.
1.
c)
Show data for different groups in multiple categories
2.
d)
Both A and B
3.
b)
8th grade
4.
c)
584
5.
c)
Science
6.
c)
32%
7.
d)
41%
8.
d)
60%
9.
d)
80%
10.
c)
40
140 %
Browse by subjects
Browse by grades
Browse by format
FAQs
What does this two-way tables and relative frequency worksheet cover?
This Grade 8 mathematics worksheet uses one comprehension video item and 10 multiple-choice questions to practice reading two-way tables and interpreting relative frequency. Students identify a table’s purpose, distinguish decimal and percentage representations, compare categories within grades, read subgroup totals, and determine percentages from survey data.
How can I use this worksheet to teach two-way tables and relative frequency?
Begin by modeling how a two-way table organizes two categorical variables, then show students how to locate a row, column, subgroup total, and corresponding percentage. Use the worksheet’s questions about favorite subjects, curfews, and bedtimes to have students explain which group total they used before selecting an answer. Review the relative-frequency items by asking students to express the same relationship as a decimal and a percentage.
What mistakes should I watch for when students complete this worksheet?
Students may confuse the total number surveyed with the number in a particular grade or category, especially when answering the questions about 8th-grade curfew and bedtime data. They may also read across the wrong grade or subject category when identifying the most popular subject or a relative frequency. Watch for students choosing a whole number when the question asks for a percentage, or treating a decimal and its percentage form as unrelated values.
How do I assign and grade this two-way tables worksheet?
You can assign this worksheet as a printable PDF or use it as a digital quiz on Wayground. It includes a complete answer key for the 11-item set, including the comprehension video item and 10 multiple-choice questions. For printable submissions, scan student work with the Wayground for Teachers app to grade it efficiently.
How can I differentiate this two-way tables and relative frequency worksheet for my students?
In the worksheet’s Advanced Settings, adjust font spacing or choose a larger font size to make the two-way-table and percentage questions easier to scan. You can also enable a dyslexia-friendly font or translate the worksheet into another language when those options support access to the multiple-choice items and their data vocabulary.
Where can I find more worksheets like this on Wayground?
Wayground offers a comprehensive collection of free printable worksheets and practice problems across all subjects, with downloadable PDFs and answer keys to support essential skills and concepts. Browse more resources at https://wayground.com/en-us/worksheets.

 Worksheets