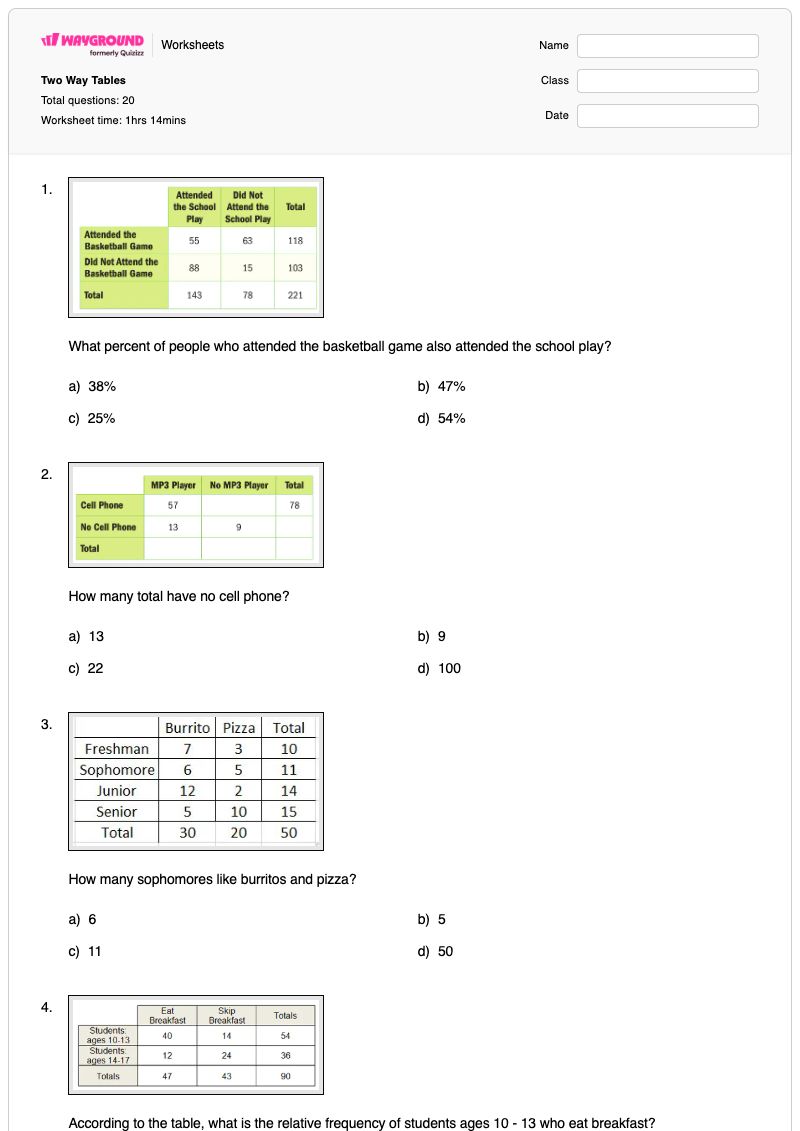
This Grade 8 mathematics worksheet gives students focused practice interpreting two-way tables. Across 20 items—19 multiple-choice questions and one fill-in-the-blank prompt—students identify frequencies, calculate grand totals and category totals, find missing values, and determine relative frequencies and percentages from table data. They also evaluate survey-based conclusions and interpret relationships between two categorical variables.
The worksheet uses practical contexts such as sports preferences, school activities, food and drink purchases, education levels, breakfast habits, weather forecasts, and grade-level preferences. It is designed for lessons on reading and analyzing two-way tables, checking whether a percentage uses the correct total, and explaining what the data shows. This free printable worksheet includes a complete answer key for efficient review, independent practice, homework, or formative assessment.
Worksheet settings
Font size
S
M
L
XL
Worksheets
Two Way Tables
Total questions: 20
Name
Class
Date
1.
What percent of people who attended the basketball game also attended the school play?
a)
38%
b)
47%
c)
25%
d)
54%
2.
How many total have no cell phone?
a)
13
b)
9
c)
22
d)
100
3.
How many sophomores like burritos and pizza?
a)
6
b)
5
c)
11
d)
50
4.
According to the table, what is the relative frequency of students ages 10 - 13 who eat breakfast?
a)
About 33%
b)
About 50%
c)
About 40%
d)
About 44%
5.
What percent of all students were females who prefer football?
a)
16%
b)
80%
c)
8%
d)
12%
6.
A survey was given to decide what sport males & females prefer to watch on TV. What is the GRAND TOTAL of people that were surveyed?
a)
48
b)
52
c)
100
d)
36
7.
How many males were surveyed?
a)
77
b)
15
c)
150
d)
52
8.
A survey explored the relationship between gender and band class. Which is a reasonable conclusion?
a)
There are more band members than non-band members
b)
There are more boys in the class than girls
c)
There are more boys in band than not in band
d)
More than half of the bands members in the class are girls
9.
How many Males have Masters/Doctoral Degree?
a)
16
b)
3
c)
46
d)
62
10.
How many Bachelor's Degrees were given?
a)
46
b)
51
c)
97
d)
5
11.
Two way tables show us the (a) or number of times something occurs.
12.
True or false:
Both 8th and 9th grade participants preferred winter the least.
a)
true
b)
false
13.
How many people purchased no food and no drink?
a)
60
b)
10
c)
20
d)
200
14.
What number should go in the blue box?
a)
21
b)
135
c)
19
d)
22
15.
What percentage of the days that it rained, did they forecast no rain?
a)
About 20%
b)
About 18%
c)
About 14%
d)
About 12%
16.
How many chemical engineers chose Science as their favorite subject?
a)
80
b)
91
c)
171
d)
262
17.
How many males were surveyed?
a)
77
b)
15
c)
150
d)
52
18.
How many total people were surveyed about what ice cream flavor they would pick?
a)
107
b)
92
c)
70
d)
269
19.
What percentage of the students have brown hair?
a)
25%
b)
60%
c)
45%
d)
50%
20.
What percentage of SUV's are driven by women?
a)
56.25%
b)
75%
c)
83.25%
d)
86.5%
Answer Key
Two Way Tables
Total questions: 20
1.
b)
47%
2.
c)
22
3.
c) 11
4.
d) About 44%
5.
c)
8%
6.
c)
100
7.
a)
77
8.
d) More than half of the bands members in the class are girls
9.
b)
3
10.
c)
97
11.
frequency
12.
a)
true
13.
b) 10
14.
a)
21
15.
c) About 14%
16.
b) 91
17.
a)
77
18.
d) 269
19.
c) 45%
20.
d) 86.5%
140 %
Browse by subjects
Browse by grades
Browse by format
FAQs
What does this two-way tables worksheet cover?
This Grade 8 worksheet builds skill with interpreting two-way tables through 20 questions: 19 multiple-choice items and one fill-in-the-blank definition. Students find row, column, and grand totals; identify frequencies and missing values; calculate percentages and relative frequencies; and judge whether conclusions about survey data are supported by the table.
How can I use this worksheet to teach students to interpret two-way tables?
Introduce the worksheet by modeling how to locate a cell, then add across rows and columns to find totals before calculating a percentage or relative frequency. Use the survey items about sports, gender, band participation, and degrees to prompt students to name the denominator they used and explain what a conclusion means in context. After guided examples, assign the remaining multiple-choice items and the frequency fill-in-the-blank question for independent practice.
What mistakes should I watch for when students complete this two-way tables worksheet?
Watch for students using a row or category total when the question asks for a percentage of all students, such as the item about females who prefer football. Students may also confuse a cell count with a row, column, or grand total, or select a conclusion that reverses the comparison shown by the table. For relative-frequency questions, have them identify both the relevant subgroup and the total number of observations before calculating.
How do I assign and grade this two-way tables worksheet?
This worksheet is available as a printable PDF and as a digital quiz on Wayground, and it includes a complete answer key. Assign the digital version for automatic checking, or print it for written practice and grade student responses with the key. You can also scan printable student work with the Wayground for Teachers app.
How can I differentiate this two-way tables worksheet?
In the worksheet’s Advanced Settings, adjust font spacing or choose a larger font size to make the two-way tables, answer choices, and percentage questions easier to read. You can also enable a dyslexia-friendly font or translate the worksheet into another language when that supports access to the table-based prompts.
Where can I find more free worksheets like this on Wayground?
Wayground offers a broad collection of free printable worksheets and practice problems across subjects, with downloadable PDFs and answer keys to help students master essential skills and concepts. Browse more resources at https://wayground.com/en-us/worksheets.

 Worksheets


