

Wayground
Proportional Relationships in Graphs - Printable Mathematics Worksheets class 7 - Wayground

Proportional Relationships in Graphs

17 questions

7th - 7th Grade

Mathematics

Proportional Relationships in Graphs is a Grade 7 mathematics worksheet that helps students interpret and analyze proportional relationships represented on coordinate graphs. Across 17 questions—including multiple-choice, multiple-select, and open-ended items—students identify unit rates, determine constants of proportionality, interpret plotted points, and decide whether a graph represents a proportional relationship. Students apply graph evidence to real-world situations involving costs, savings, study time, fabric, travel, food purchases, and water tanks. Open-ended prompts require students to calculate quantities and explain their reasoning using features of the graph, while selected-response items reinforce recognition of unit-rate points and proportional patterns. This free printable worksheet includes a complete answer key and is designed for Grade 7 math instruction, guided practice, independent work, or formative assessment.

Worksheet settings

Font size

S
M
L
XL
Worksheets

Proportional Relationships in Graphs

Total questions: 17

Name
Class
Date
1.

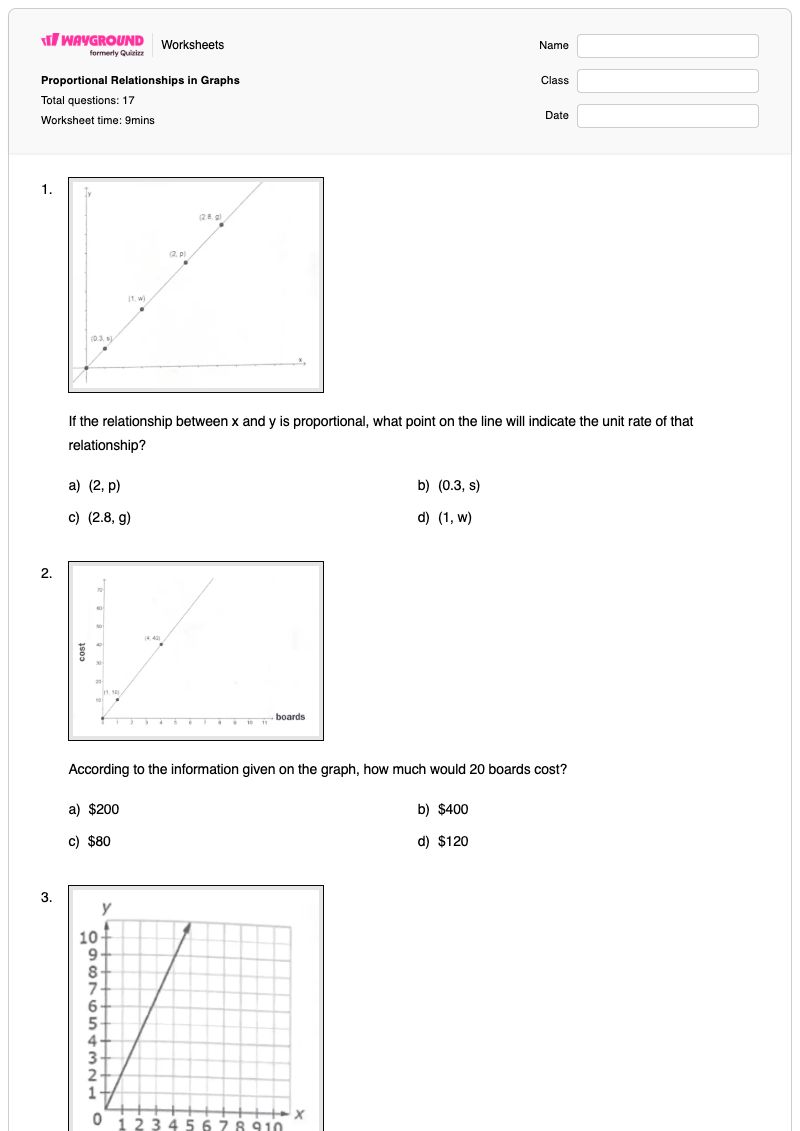
If the relationship between x and y is proportional, what point on the line will indicate the unit rate of that relationship?

a)

(2, p)

b)

(0.3, s)

c)

(2.8, g)

d)

(1, w)

2.

According to the information given on the graph, how much would 20 boards cost?

a)

$200

b)

$400

c)

$80

d)

$120

3.

Does the graph represent a proportional relationship? Make sure to explain your answer

4 lines
4.

What do the points on the graph mean? Select all the correct answers.

a)

After 2 weeks, you have saved $94

b)

After 94 weeks, you have saved $2

c)

After 10 weeks, you save $94

d)

After 4 weeks, you have saved $188

e)

After 0 weeks, you have save $10

5.

According to the graph, what is the constant of proportionality?

a)

35\frac{3}{5}  

b)

5

c)

3

d)

13\frac{1}{3}  

6.

What is the unit rate for the number of hours of study each week per class?

a)

25 hours

b)

5 hours

c)

7 hours

d)

10 hours

7.

Which graph show a line with C.O.P of 34\frac{3}{4}  

a)
b)
c)
d)
8.

What is the constant of proportionality of the graph? Explain how you know.

4 lines
9.

The graph shows the cost of oranges per bag. What is the cost of 4 bags of oranges?

4 lines
10.

Samir believes this graph is proportional and that the C.O.P is 3. Do you agree with the Samir. Explain why or why not.

4 lines
11.

Angela uses this graph to purchase potatoes for her restaurant. How many pounds of potatoes is she able to purchase with $30?

4 lines
12.

Maya uses blue and orange fabric to make identical wall decorations. The graph below shows the relationship between the amounts of blue and orange fabric used. What is the constant of proportionality as shown in the graph?

a)

310\frac{3}{10}  

b)

25\frac{2}{5}  

c)

37\frac{3}{7}  

d)

12\frac{1}{2}  

13.

The graph shows the relationship between x, the amount of time in hours, and y, the distance traveled in miles, by a probe before it reaches Mars. Does the graph represent a proportional relationship? Why or Why Not. Then Determine the number of miles the probe travels in 5.5 hours.

4 lines
14.

The line graphed below show the amount of water in two tanks as they are being filled over time. For each tank, explain whether or not there is a proportional relationship between the amount of water, in gallons, and the time, in minutes. If there is a proportional relationship, identify the unit rate. Be sure to use specific features of the graph to support your answer.

4 lines
15.

The graph below shows the relationship between the number of people in a group and the total cost of admission tickets for a circus. Which point on the graph represents the unit rate?

a)

(0,0)

b)

(1, 15)

c)

(15, 1)

d)

(8, 120)

16.

A grocery store sells sliced turkey. The graph shows the relationship between the weight of the sliced turkey and the total cost of the sliced turkey. Two points, R and W, are laced on the graph shows below. Which statement about the graph is true?

a)

Point R means that the unit rate is $10.00 per pound

b)

Point R means that the unit rate is 4 pounds per dollar.

c)

Point W means that the unit rate is $2.50 per pound.

d)

Point W means that the unit rate is 2.5 pounds per dollar

17.

The graph below shows the total distance, in miles, traveled by a towboat over time, in hours. Which statement BESTS described the meaning of the coordinates of point F on the graph.

a)

It shows the unit rate of the graph in hours per mile.

b)

It shows the unit rate of the graph in miles per hour.

c)

It shows the time, in hours, it takes the towboat to travel 1 mile

d)

It shows the distance traveled, in miles, by the towboat after 5.25 hours.

Answer Key

Proportional Relationships in Graphs

Total questions: 17

1.
d)

(1, w)

2.
a)

$200

3.
n/a
4.
a)

After 2 weeks, you have saved $94

, d)

After 4 weeks, you have saved $188

5.
a)

35\frac{3}{5}  

6.
b)

5 hours

7.
d)
8.
n/a
9.
n/a
10.
n/a
11.
n/a
12.
c)

37\frac{3}{7}  

13.
n/a
14.
n/a
15.
b)

(1, 15)

16.
c)

Point W means that the unit rate is $2.50 per pound.

17.
b)

It shows the unit rate of the graph in miles per hour.

FAQs

What does the Proportional Relationships in Graphs worksheet cover?

This Grade 7 math worksheet focuses on interpreting proportional relationships from graphs, including identifying the unit-rate point, finding the constant of proportionality, interpreting plotted points, and determining whether a graph represents a proportional relationship. Its 17 mixed-format questions ask students to select answers, choose multiple graph interpretations, calculate values in real-world contexts, and explain conclusions using graph evidence.

How can I use this worksheet to teach proportional relationships from graphs?

Begin by reviewing how the point with an x-value of 1 represents the unit rate and how the constant of proportionality connects x and y. Then model one graph-based cost or savings example before having students work through the selected-response items and the open-ended prompts that require explanations. Use the questions about the probe, water tanks, and purchases to discuss how students can justify proportionality and calculate an unknown quantity from a graph.

What mistakes should I watch for when students complete this graphing worksheet?

Students may reverse the coordinates when interpreting a point, confuse the unit-rate point with the origin, or calculate the constant of proportionality using the wrong ratio. In the multiple-select item, they may select statements that switch the weeks and savings values. For the open-ended questions, check that students support a proportionality decision with graph features rather than giving only a yes-or-no response, and that they use the correct unit when solving context problems.

How do I assign and grade this proportional relationships worksheet?

You can assign Proportional Relationships in Graphs as a printable PDF or as a digital quiz on Wayground. The worksheet includes a complete answer key for its multiple-choice, multiple-select, and open-ended items, and printable submissions can be graded by scanning student work with the Wayground for Teachers app. The printable format can also support classrooms that are reducing screen time.

How can I differentiate this proportional relationships worksheet for my students?

Use the worksheet’s Advanced Settings to adjust font spacing and font size so graph labels, answer choices, and written-explanation prompts are easier to read. You can also apply a dyslexia-friendly font or translate the worksheet into another language, helping students access the graph interpretations and real-world proportionality problems in a format that suits their needs.

Where can I find more worksheets like this on Wayground?

Wayground offers a comprehensive collection of free printable worksheets and practice problems across subjects, with downloadable PDFs and answer keys to help students master essential skills and concepts. Browse more resources at https://wayground.com/en-us/worksheets.