Enhance Class 7 students' understanding of data types through Wayground's comprehensive collection of free Science worksheets, featuring engaging practice problems, printable PDFs, and complete answer keys for effective classroom learning.
Explore printable Data Types worksheets for Class 7
Data types worksheets for Class 7 students available through Wayground (formerly Quizizz) provide comprehensive practice in understanding and working with different categories of scientific information. These worksheets strengthen students' ability to distinguish between qualitative and quantitative data, identify discrete versus continuous variables, and recognize appropriate measurement scales for various scientific investigations. Students engage with practice problems that challenge them to classify observations, measurements, and experimental results into proper data categories, building foundational skills essential for scientific inquiry. Each worksheet includes a detailed answer key and is available as a free pdf download, making these printables accessible resources for reinforcing data analysis concepts across multiple learning environments.
Wayground (formerly Quizizz) supports educators with millions of teacher-created resources specifically designed for Class 7 data types instruction, featuring robust search and filtering capabilities that align with science education standards. Teachers can easily locate worksheets that match their specific curriculum needs and differentiate instruction through customizable content that addresses varying skill levels within their classrooms. The platform's flexible format options, including both printable pdf versions and interactive digital worksheets, accommodate diverse teaching preferences and classroom technologies. These comprehensive tools enable educators to efficiently plan targeted lessons, provide remediation for struggling learners, offer enrichment opportunities for advanced students, and deliver consistent skill practice that builds students' competency in analyzing and categorizing scientific data types.
FAQs
How do I teach students the difference between qualitative and quantitative data?
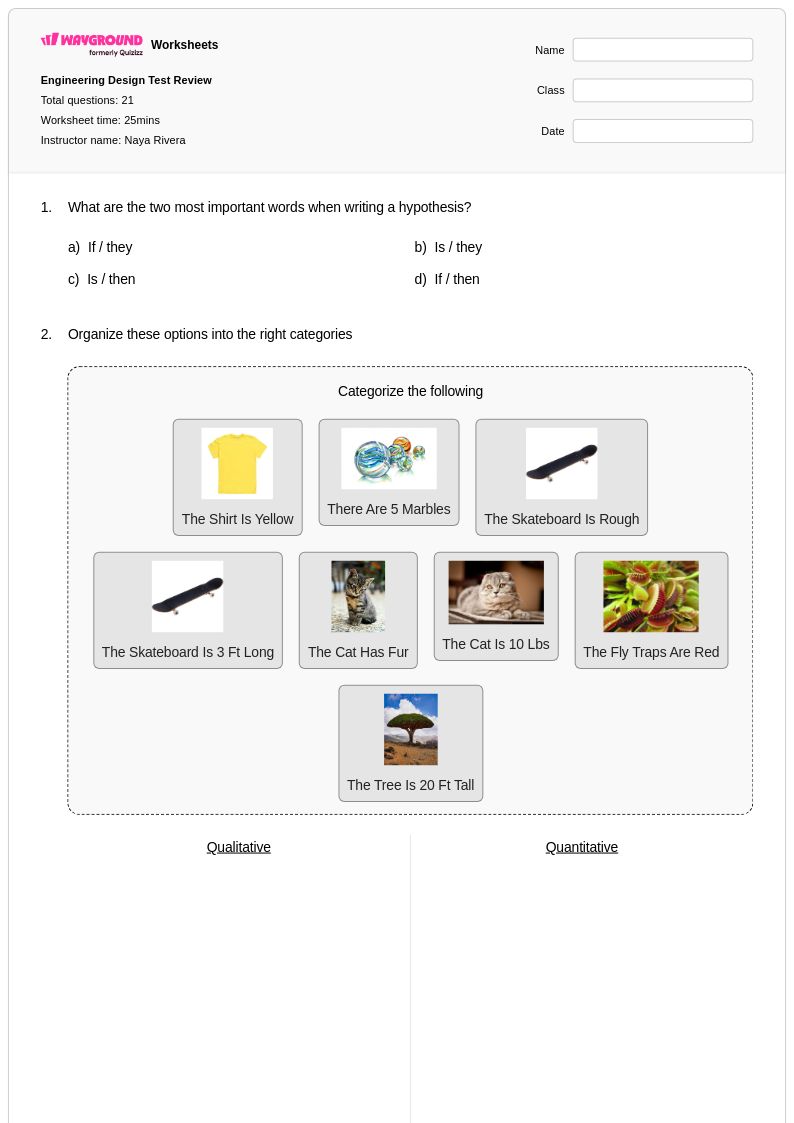
Start by grounding students in concrete examples: qualitative data describes characteristics or qualities (e.g., color, texture, smell), while quantitative data involves measurable numbers (e.g., temperature, mass, count). A reliable classroom strategy is to present students with a real or simulated experiment and ask them to sort all observations into one of the two categories before discussing why the distinction matters for drawing conclusions. Reinforcing this with classification exercises — where students label data from authentic scientific scenarios — builds the pattern recognition they need for more advanced analysis.
What is the difference between discrete and continuous data, and how do I explain it to students?
Discrete data consists of countable, distinct values with no meaningful values in between (e.g., number of students, number of trials), while continuous data can take any value within a range and is typically measured rather than counted (e.g., height, time, temperature). A useful classroom analogy is to contrast counting shoes in a room (discrete) versus measuring the length of each shoe (continuous). Students often confuse the two when dealing with whole-number measurements, so emphasizing whether the variable is inherently countable or measurable helps clarify the distinction.
What are common mistakes students make when identifying data types in science?
One of the most frequent errors is assuming that any data involving numbers is automatically quantitative — students often misclassify numbered categories (like survey ratings or jersey numbers) as quantitative when they are actually categorical. Another common mistake is conflating discrete and continuous data, particularly when continuous measurements happen to produce whole numbers. Students also struggle to identify the appropriate data type for a given research question, often selecting a collection method before considering what type of variable they are actually measuring.
What kinds of practice exercises help students get better at classifying and analyzing data types?
Effective practice includes data-sorting activities where students categorize sets of real-world observations, scenario-based problems that ask students to select the appropriate data type for a described experiment, and measurement scale exercises that distinguish nominal, ordinal, interval, and ratio levels. Problems that tie data classification directly to experimental design — asking students to justify why a certain data type fits a specific research question — are especially valuable because they develop reasoning skills, not just recall. Repeated exposure to varied scientific contexts, from life science to physical science, strengthens transfer of this skill.
How do I use data types worksheets effectively in my classroom?
Data types worksheets on Wayground are available as printable PDFs for traditional classroom use and in digital formats for technology-integrated environments, giving teachers flexibility regardless of their setup. Teachers can also host the worksheets as a live quiz on Wayground, which enables real-time participation and immediate feedback. For classes with diverse learners, Wayground's accommodation tools allow teachers to enable features like read aloud, extended time, or reduced answer choices for individual students, ensuring all students can access the material without disrupting the experience for the rest of the class.
How do data types connect to broader science and engineering practices?
Understanding data types is foundational to science and engineering practices because the type of data collected directly determines which analytical methods are appropriate and what kinds of conclusions can be drawn. Choosing the wrong data type — or misidentifying what was collected — can invalidate an entire experimental analysis. Teaching students to match data types to research questions prepares them for authentic scientific reasoning, from designing investigations to interpreting results and communicating findings accurately.