
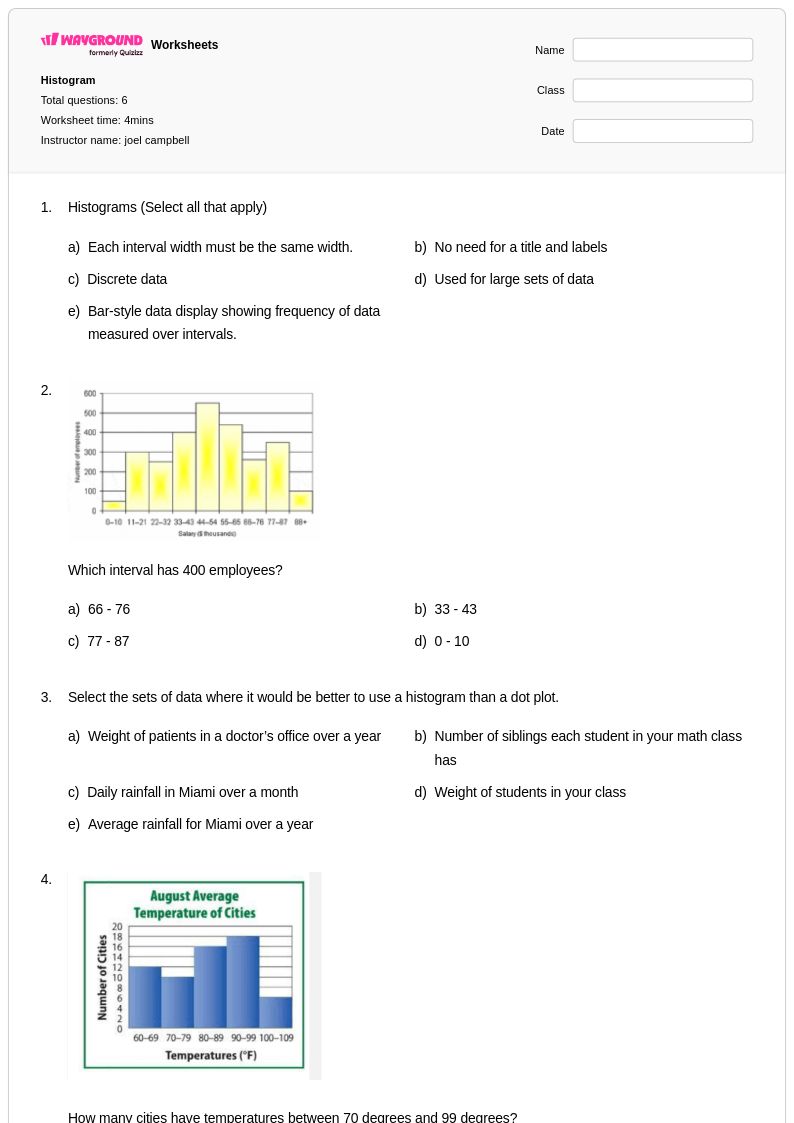
6Q
9th - 12th
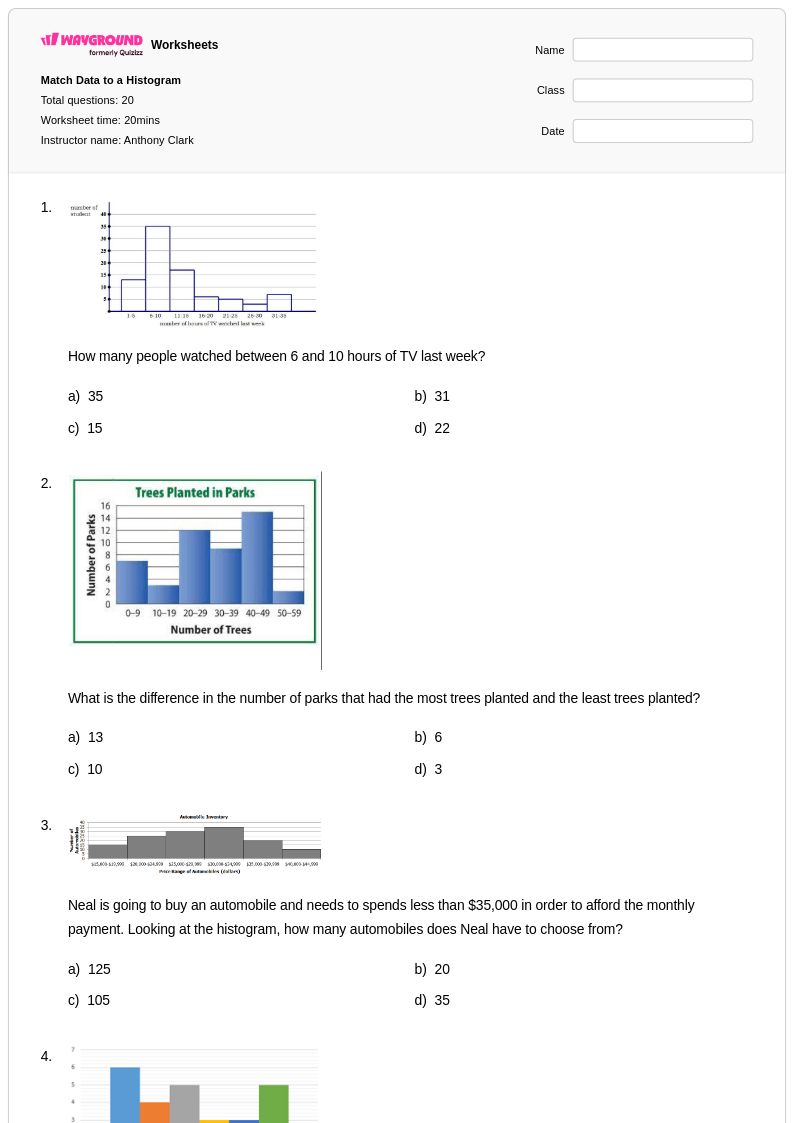
20Q
9th - Uni
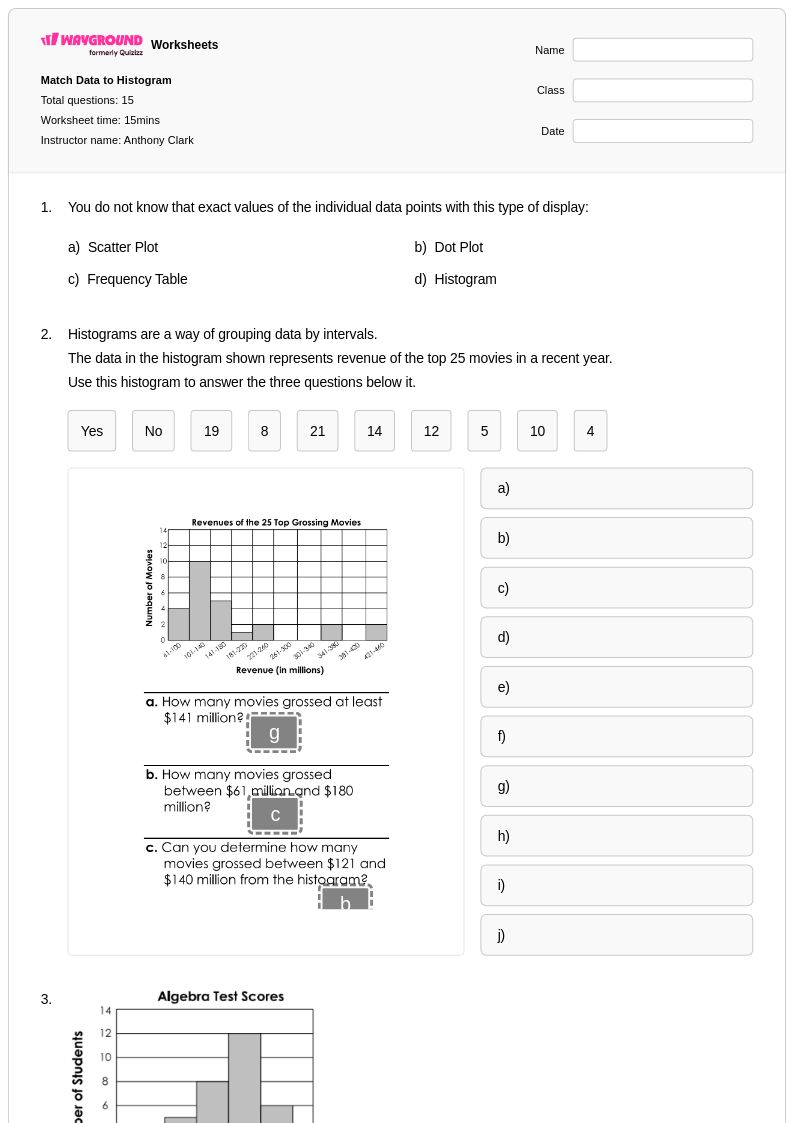
15Q
9th - Uni
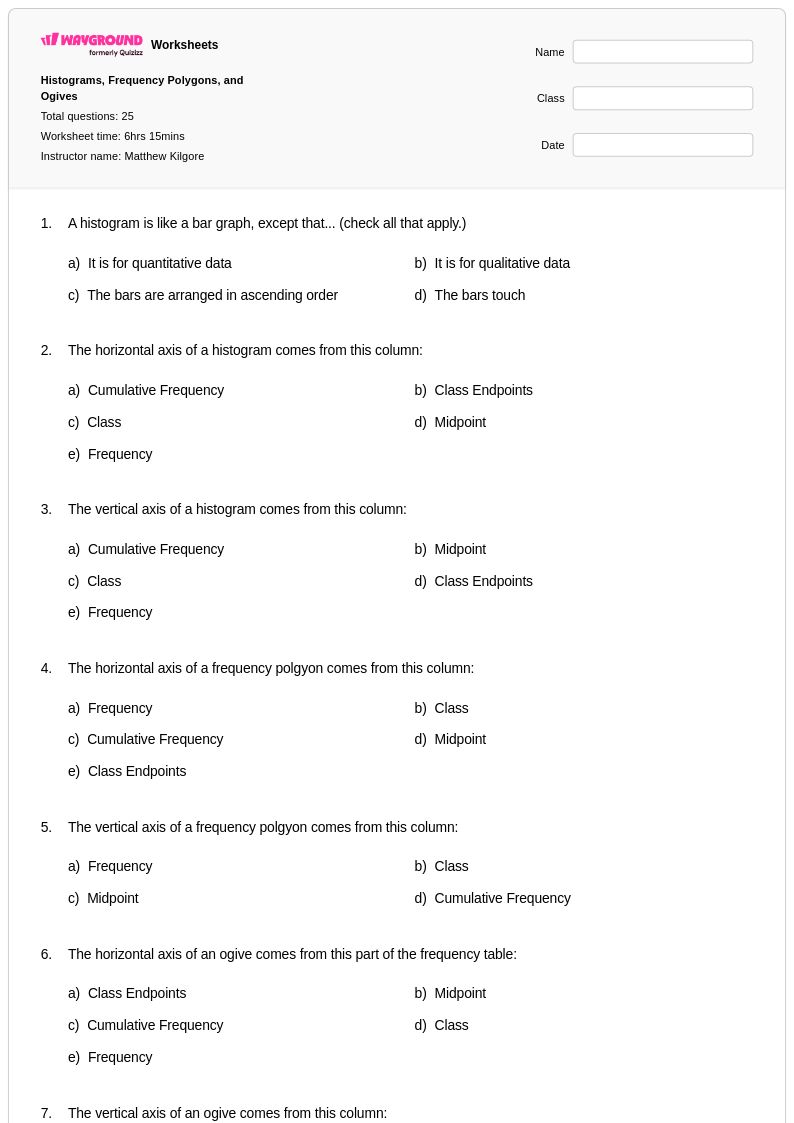
25Q
11th - Uni
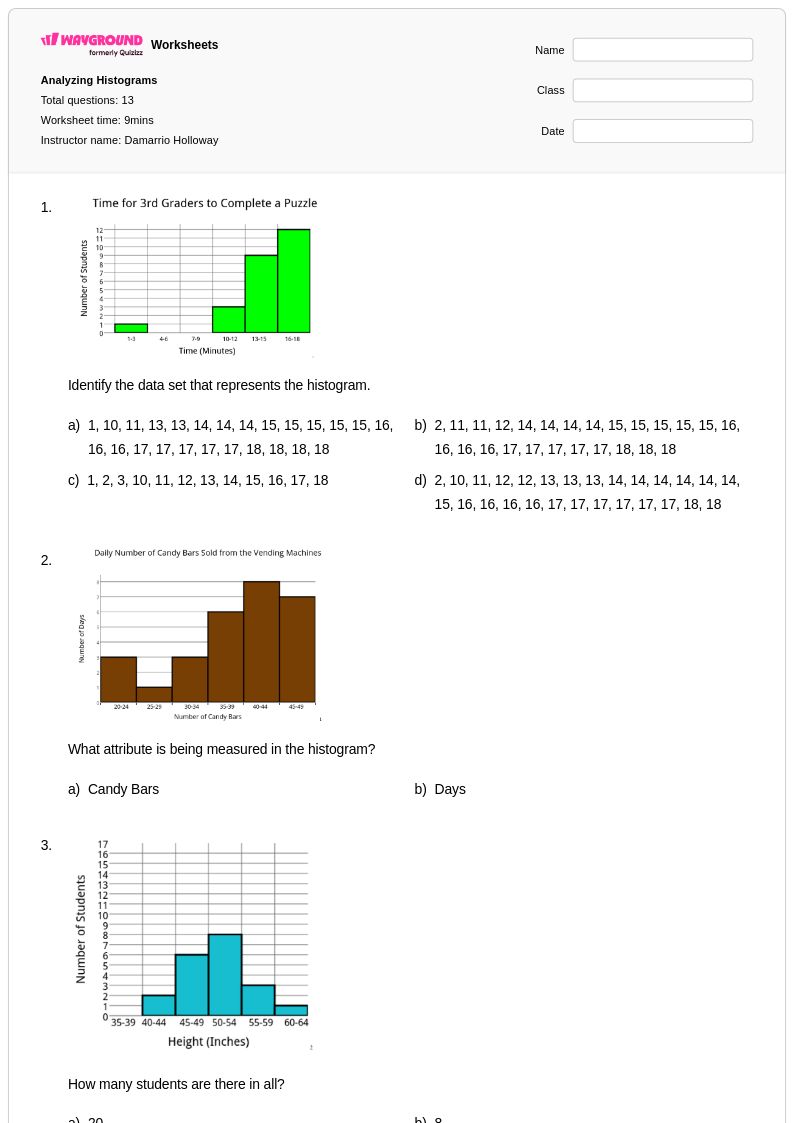
13Q
10th - 12th
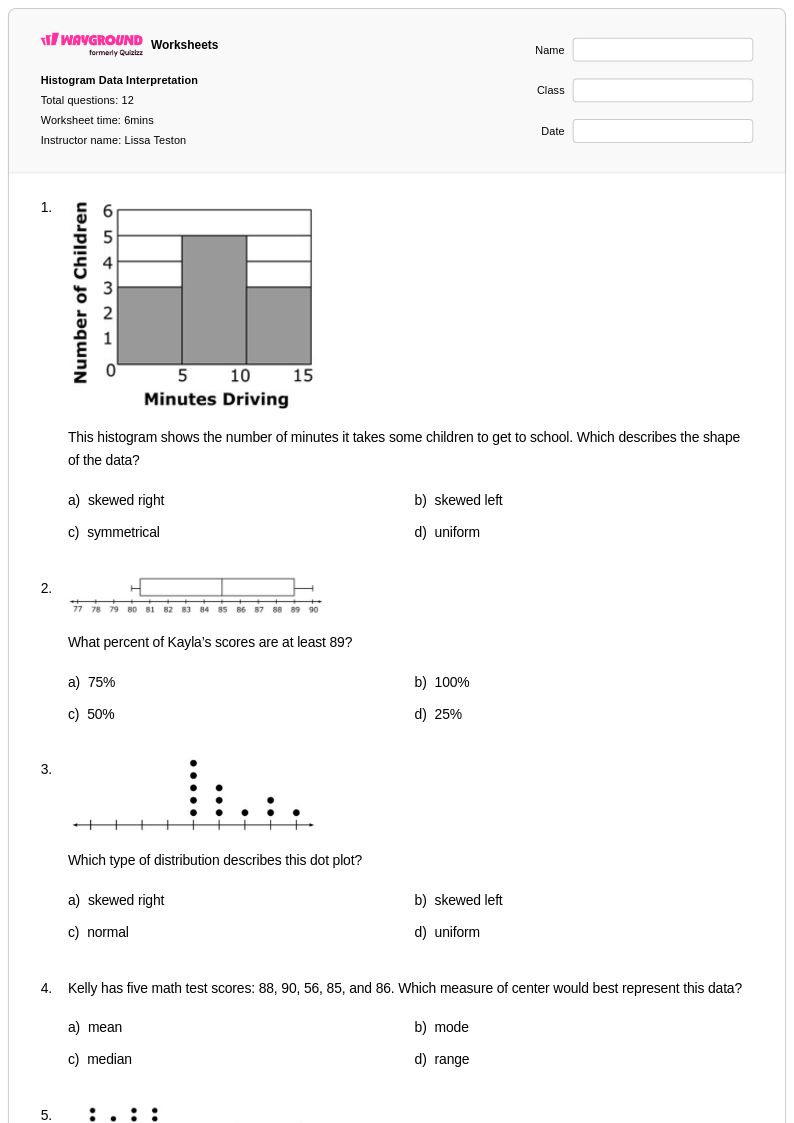
12Q
6th - Uni
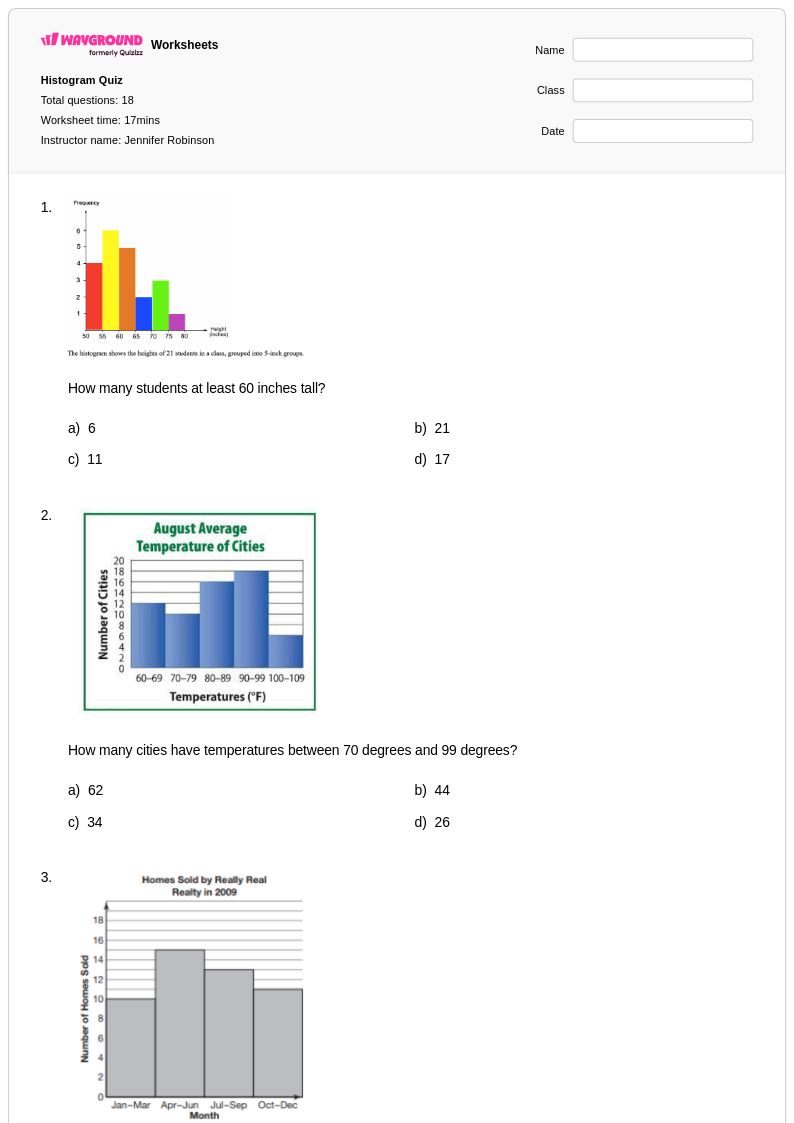
18Q
11th
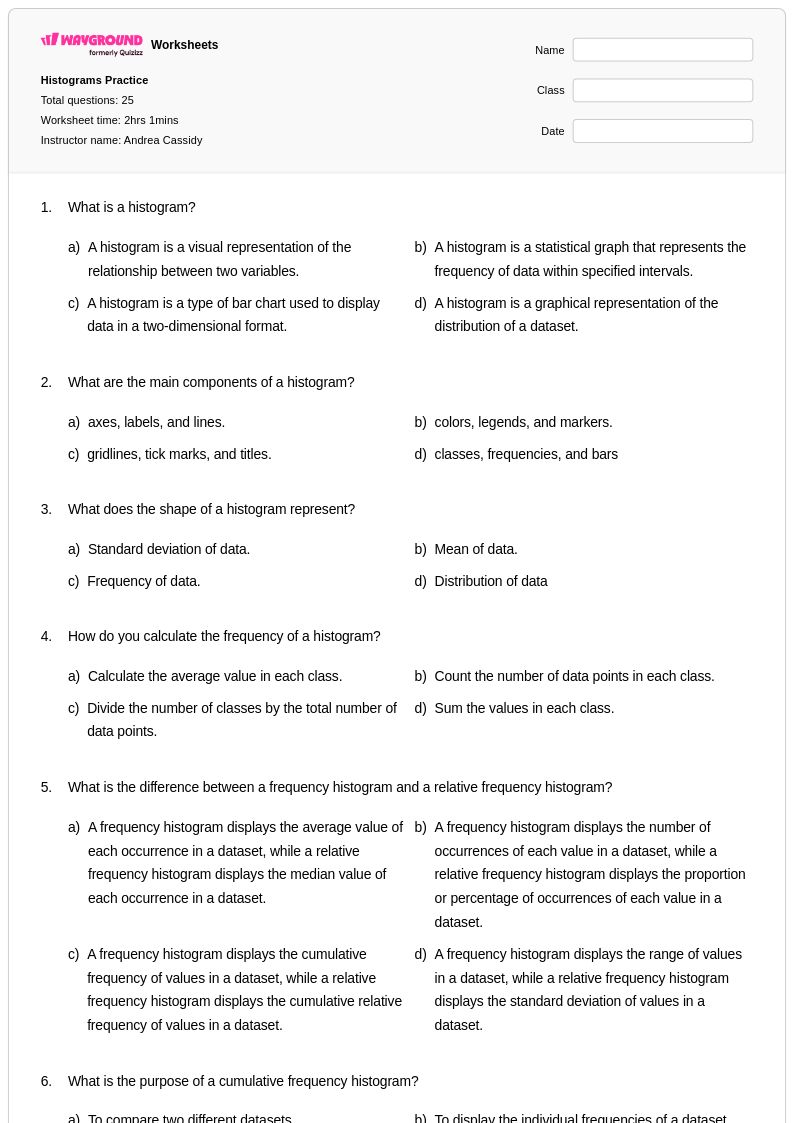
25Q
9th - 12th
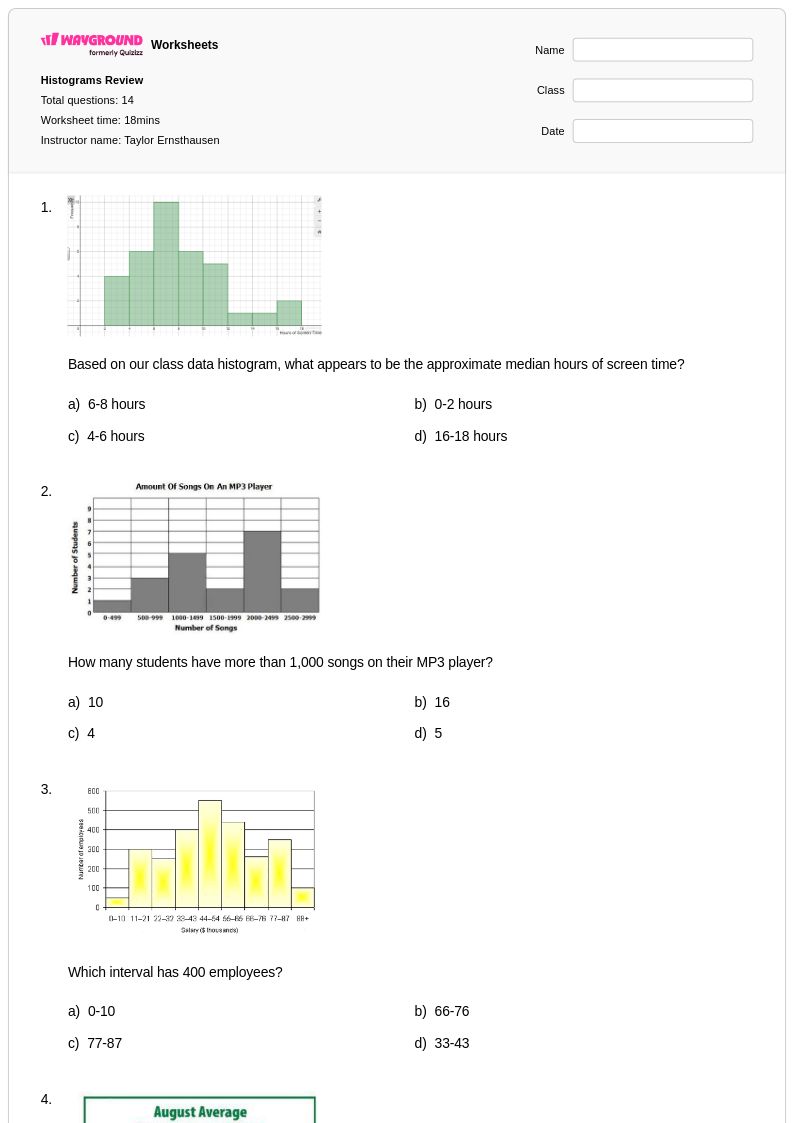
14Q
9th - 12th
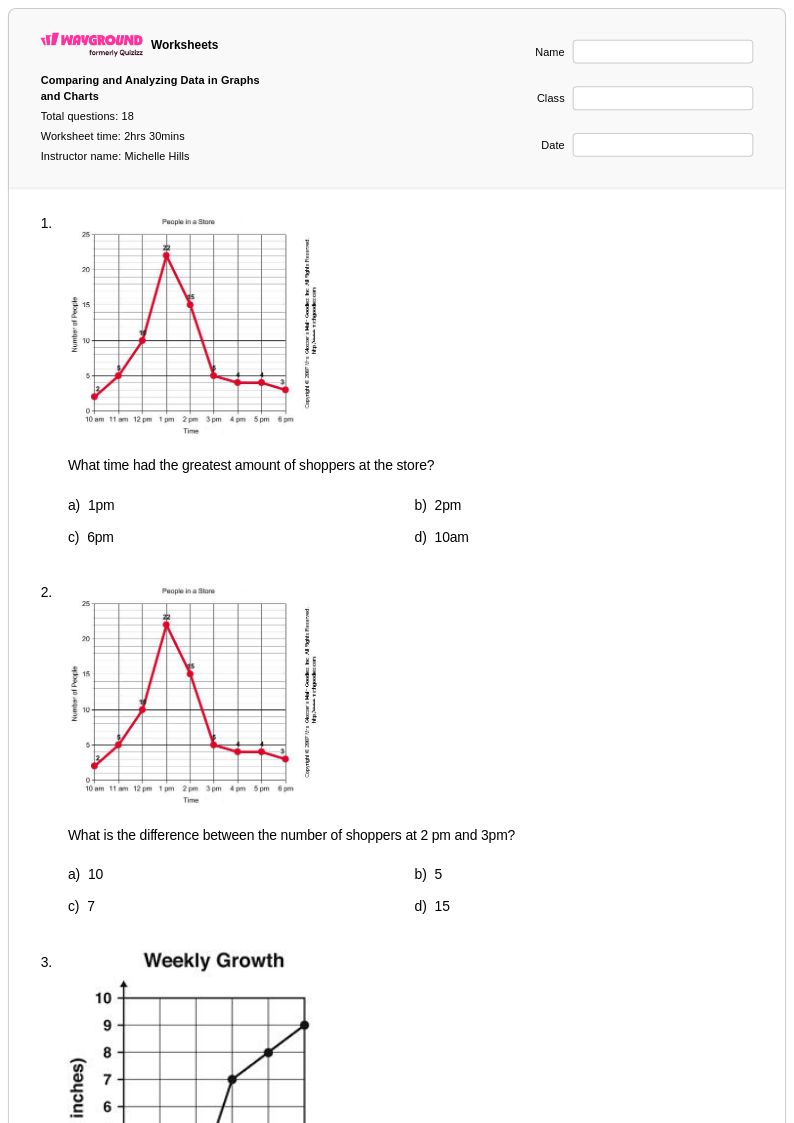
18Q
9th - 12th
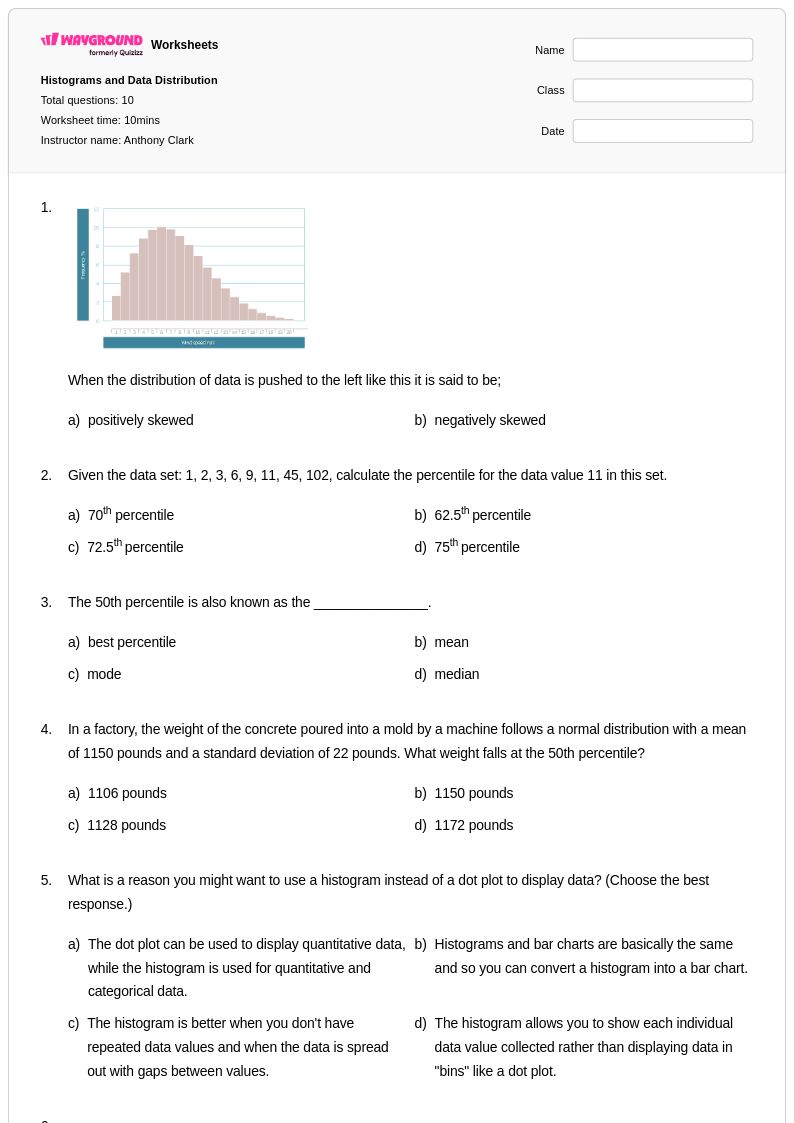
10Q
10th - Uni
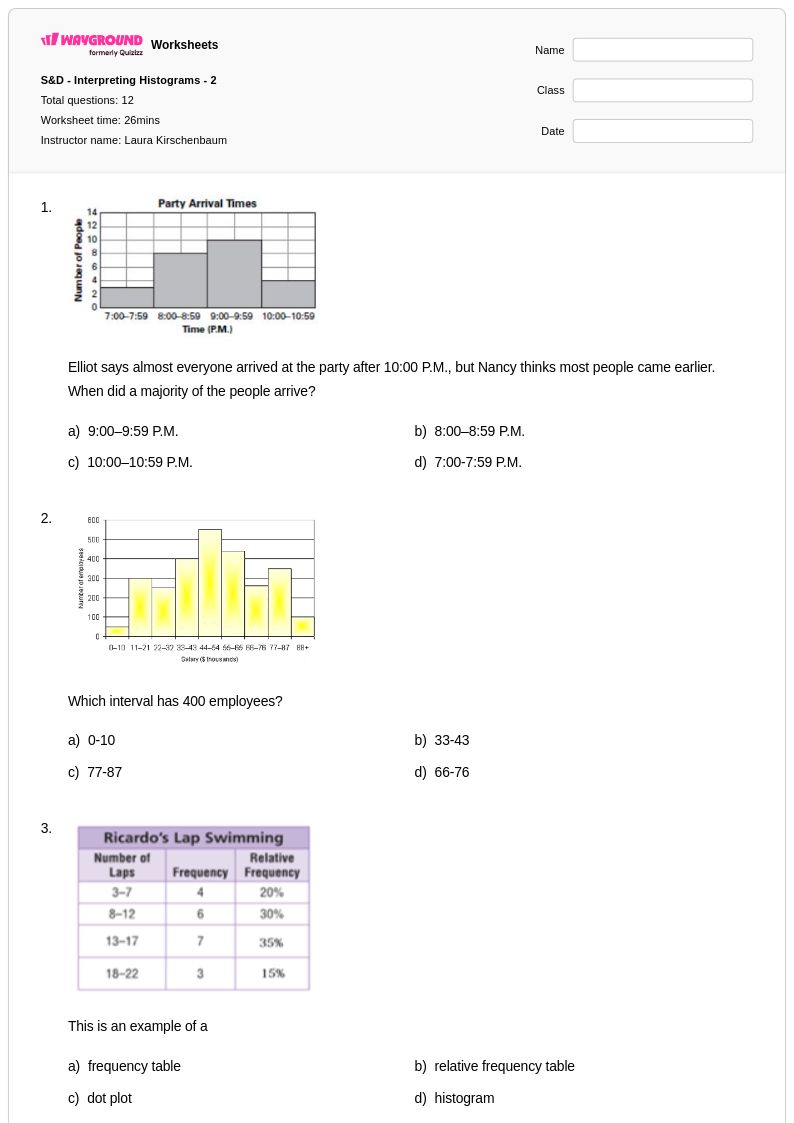
12Q
9th - 12th
20Q
7th - Uni
14Q
7th - Uni
28Q
9th - 12th
25Q
9th - 12th
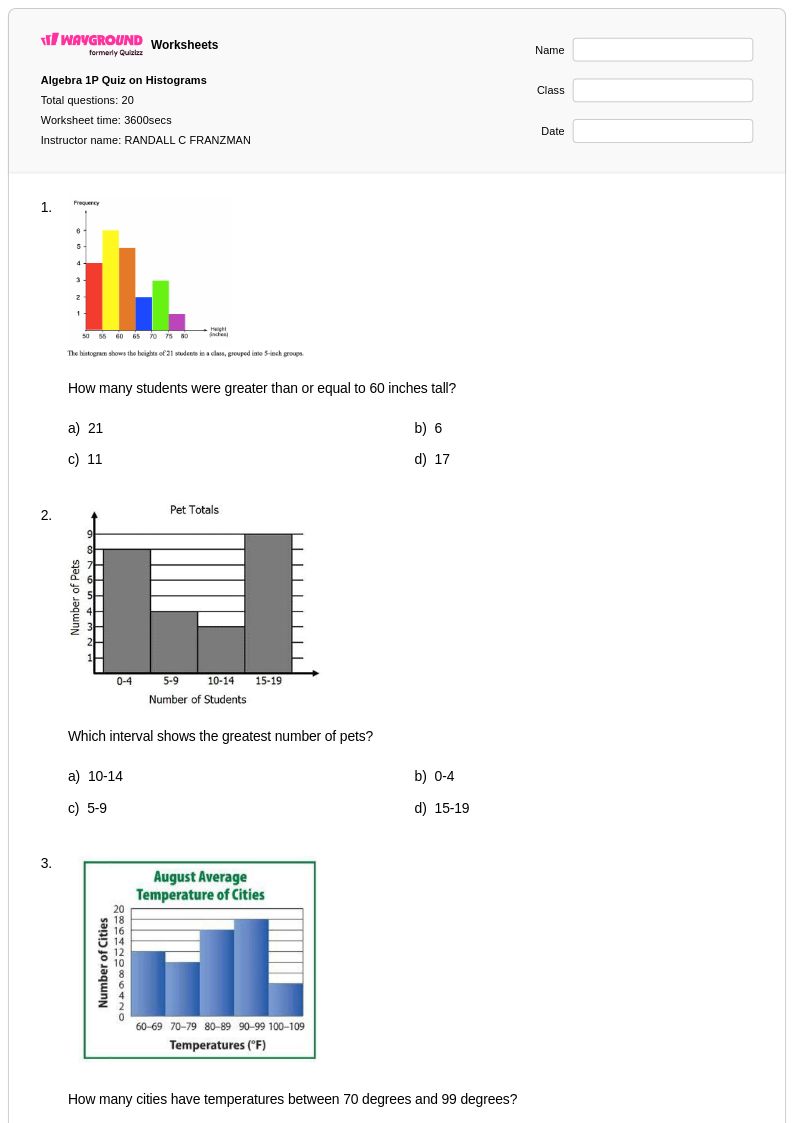
20Q
9th - 12th
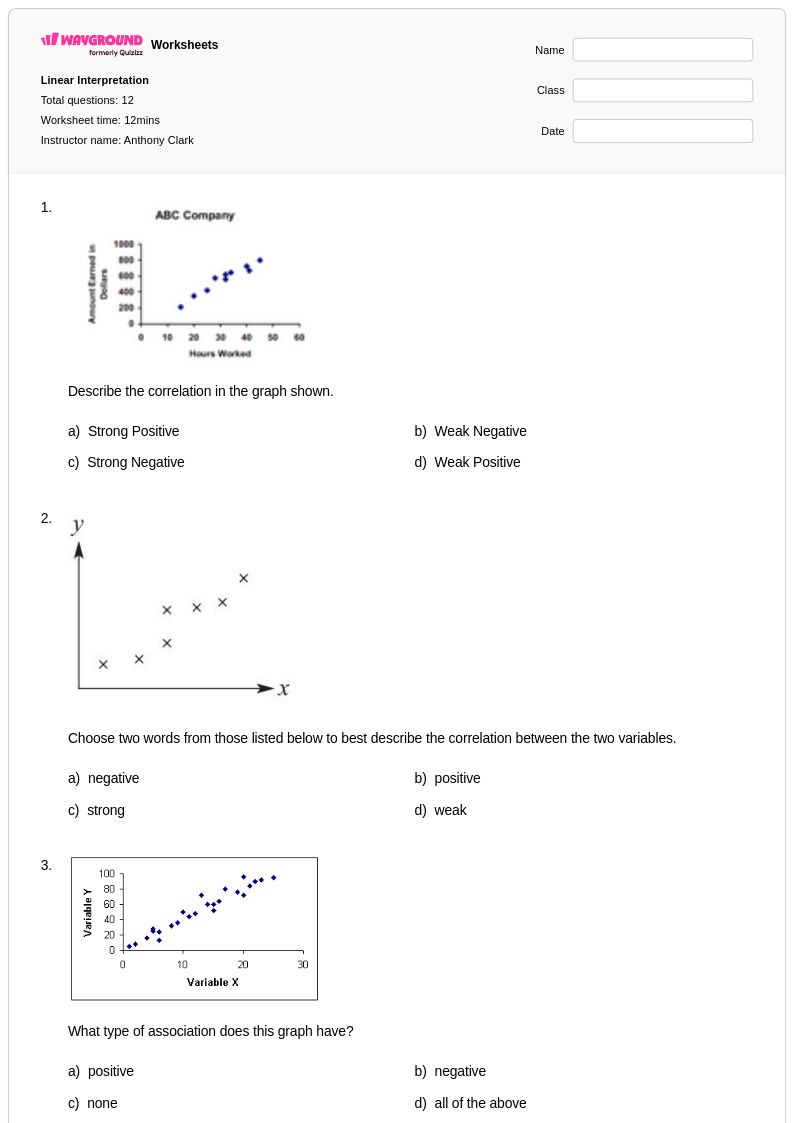
12Q
9th - Uni
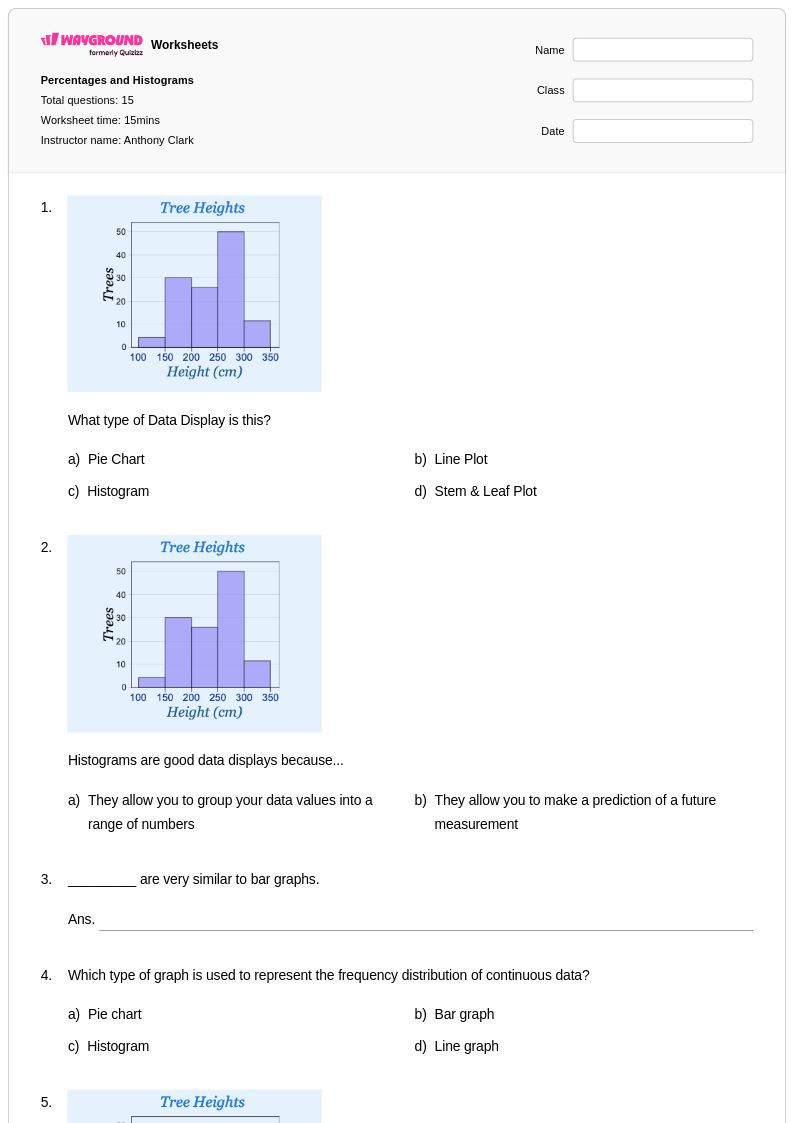
15Q
9th - Uni
16Q
9th - 12th
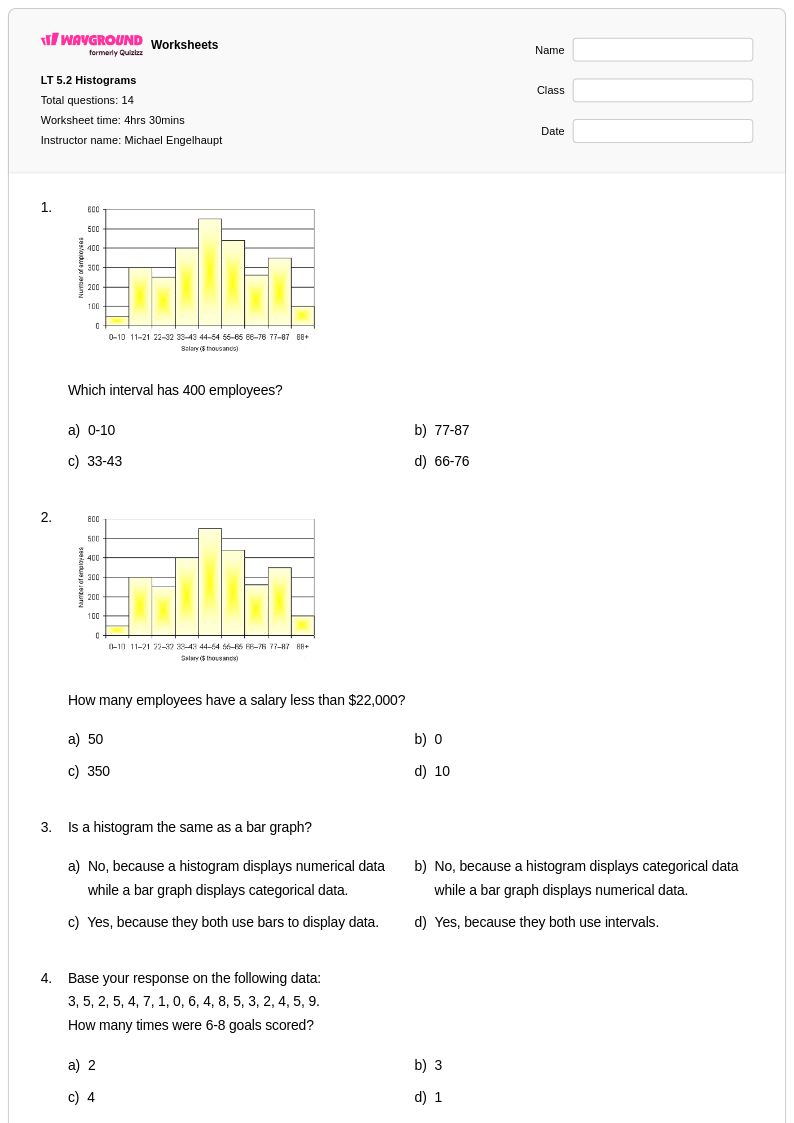
14Q
10th - 12th
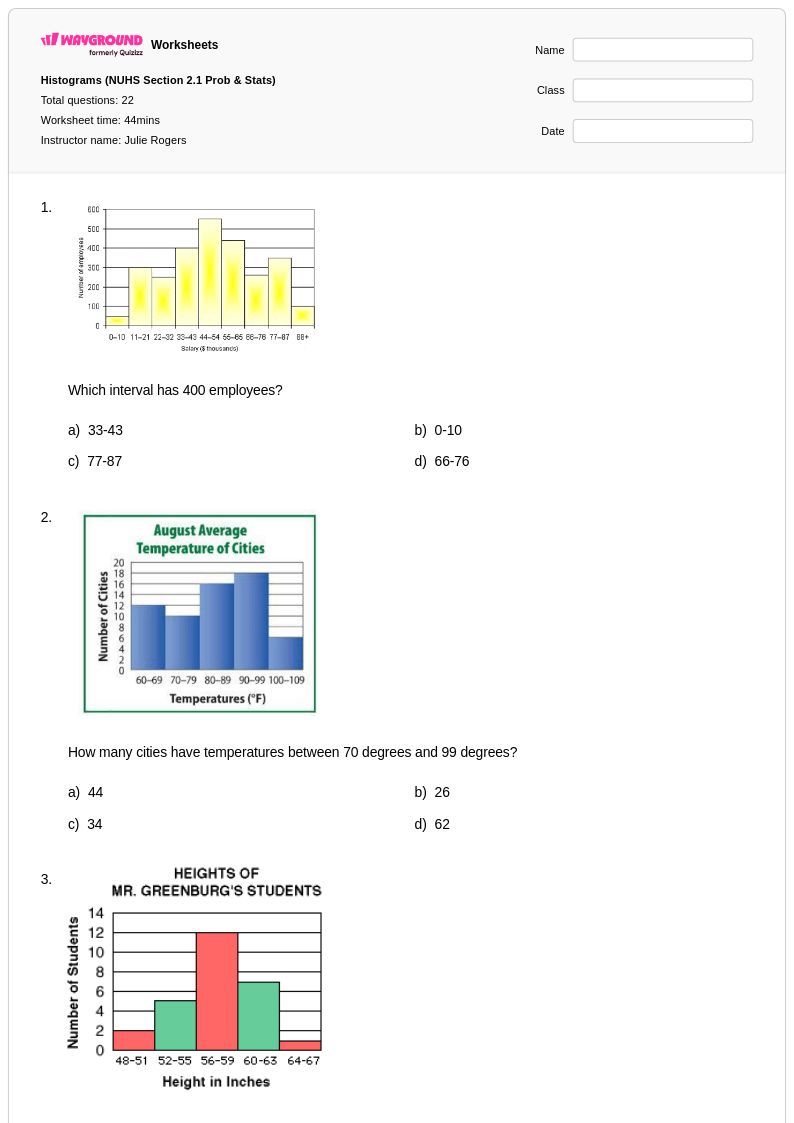
22Q
10th - 12th
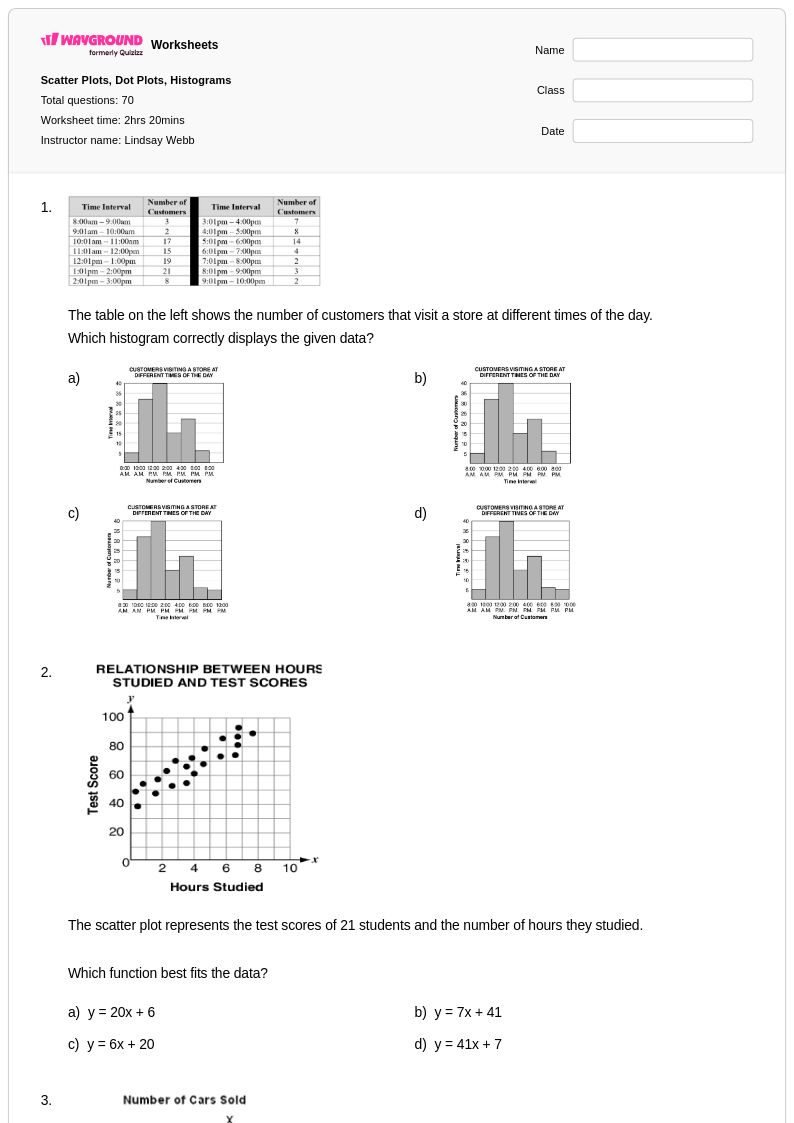
70Q
9th - 12th
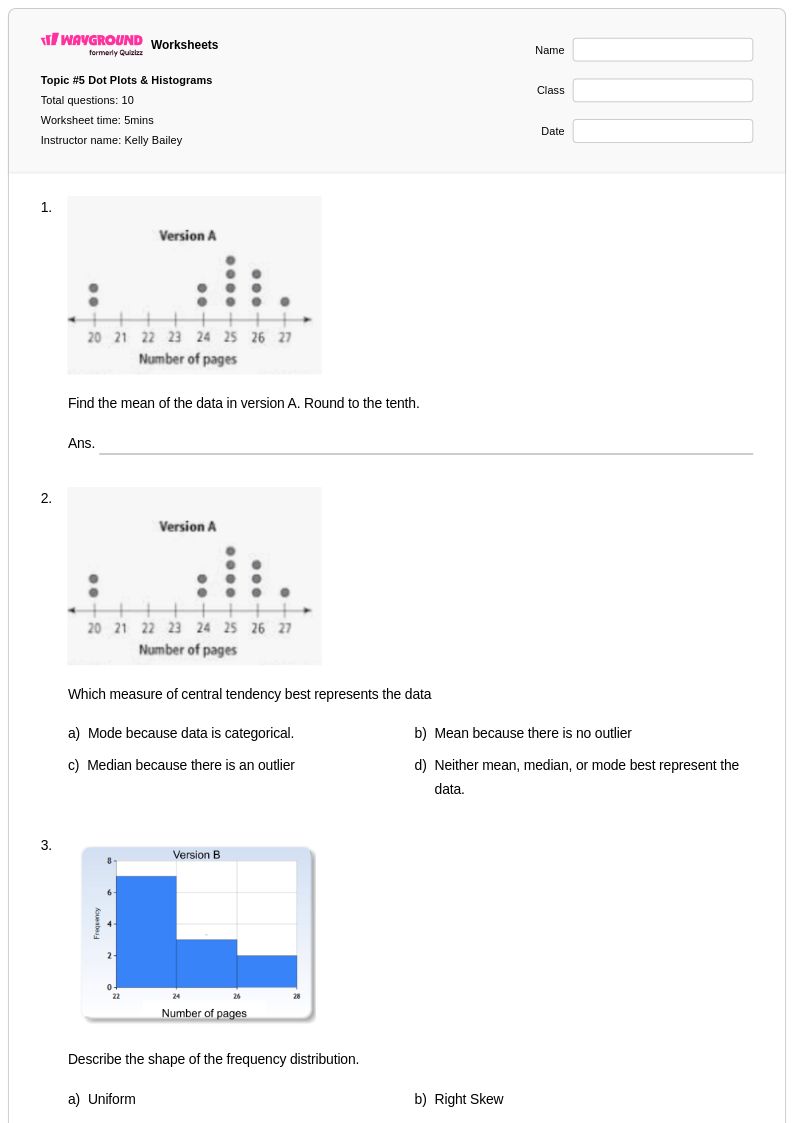
10Q
9th - 11th
Explore planilhas Histogram Interpretation por notas
Explore outras planilhas de assuntos para class 11
Explore printable Histogram Interpretation worksheets for Class 11
Histogram interpretation worksheets for Class 11 mathematics provide students with essential practice in analyzing and understanding data distribution through visual representations. These comprehensive resources available through Wayground (formerly Quizizz) focus on developing critical statistical literacy skills including reading histogram bars, determining frequency distributions, identifying data patterns, and drawing meaningful conclusions from graphical displays. Students work through carefully structured practice problems that progress from basic histogram reading to complex interpretation tasks involving measures of central tendency, variability, and data comparison. Each worksheet comes with a detailed answer key to support independent learning and self-assessment, while the free printable pdf format ensures accessibility for both classroom instruction and homework assignments.
Wayground (formerly Quizizz) empowers educators with millions of teacher-created histogram interpretation resources specifically designed to meet diverse Class 11 mathematics learning needs. The platform's robust search and filtering capabilities allow teachers to quickly locate worksheets aligned with state and national mathematics standards, while built-in differentiation tools enable customization for varying skill levels within the classroom. These flexible resources are available in both printable and digital formats, including downloadable pdfs, making them ideal for lesson planning, targeted remediation sessions, enrichment activities, and ongoing skill practice. Teachers can seamlessly integrate these histogram interpretation worksheets into their data and graphing curriculum to strengthen students' analytical thinking and statistical reasoning abilities through systematic, scaffolded learning experiences.
FAQs
How should I teach histogram interpretation in Grade 11?
What are effective Grade 11 histogram practice activities?
What misconceptions should I look for when assessing histogram interpretation?
How do I assign these Grade 11 histogram worksheets?
Is Grade 11 histogram interpretation aligned with Common Core?
How can I support students who struggle with histogram questions?
What histogram skills are appropriate for Grade 11?