Free Printable Map Projections Worksheets for Class 11
Enhance Class 11 students' understanding of map projections with our comprehensive collection of free worksheets, featuring printable PDFs, practice problems, and answer keys to master geographic representation techniques.
Explore printable Map Projections worksheets for Class 11
Map projections for Class 11 students represent a critical component of advanced geographic literacy, requiring students to understand how three-dimensional Earth surfaces are translated onto two-dimensional representations. Wayground's comprehensive collection of map projection worksheets provides educators with expertly designed materials that challenge students to analyze different projection methods, including Mercator, Robinson, and Peters projections, while examining the inherent distortions each creates in area, shape, distance, and direction. These practice problems systematically build students' analytical skills as they compare projection accuracy for different purposes, evaluate the historical and political implications of projection choices, and develop spatial reasoning abilities essential for geographic interpretation. The worksheets include detailed answer keys that support both independent study and classroom instruction, with free printables available in convenient pdf format to accommodate various learning environments and teaching preferences.
Wayground's extensive database draws from millions of teacher-created resources specifically designed to support Class 11 geography instruction, offering robust search and filtering capabilities that allow educators to quickly locate map projection materials aligned with state and national geography standards. The platform's differentiation tools enable teachers to customize worksheet difficulty levels, ensuring appropriate challenges for students across varying skill levels while maintaining academic rigor appropriate for upper-level high school coursework. Whether delivered in traditional printable format or interactive digital versions, these resources seamlessly integrate into lesson planning, providing structured opportunities for skill reinforcement, remediation for struggling learners, and enrichment activities for advanced students. The comprehensive nature of the collection supports educators in developing students' critical thinking about cartographic representation, spatial analysis, and the intersection of geography with technology and global perspectives essential for 21st-century geographic literacy.
FAQs
How do I teach map projections to students?
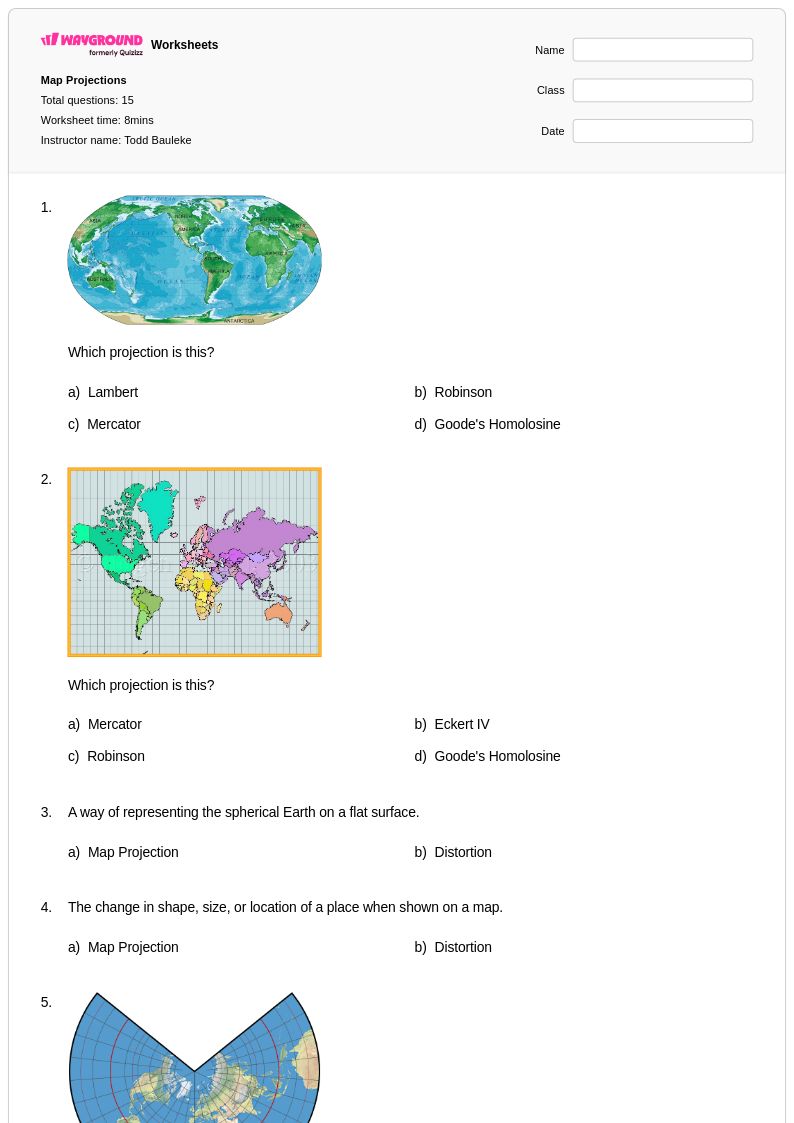
Start by helping students visualize the core problem: a sphere cannot be flattened without distortion, so every map projection involves a trade-off. Introduce two or three projections side by side, such as Mercator, Robinson, and Peters, and ask students to compare how the same landmasses appear differently across each. Grounding the lesson in real-world use cases, like why navigators historically preferred the Mercator projection, helps students understand that projection choice is intentional, not arbitrary.
What are the most common misconceptions students have about map projections?
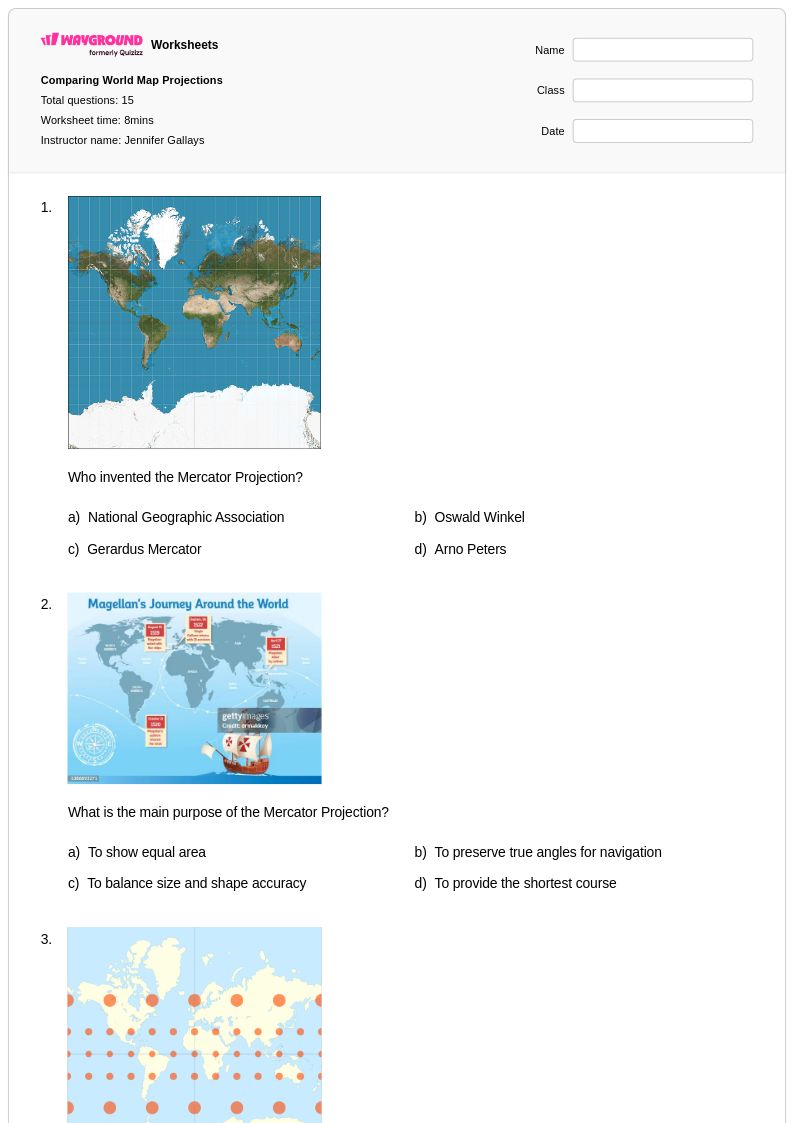
The most persistent misconception is that the Mercator projection accurately represents the relative size of countries and continents, when in fact it significantly exaggerates landmasses near the poles. Students often assume that all world maps are equally accurate and interchangeable, not realizing that every projection distorts at least one property: size, shape, distance, or direction. Explicitly comparing Greenland and Africa across multiple projections is one of the most effective ways to correct this misunderstanding.
What exercises help students practice comparing different map projections?
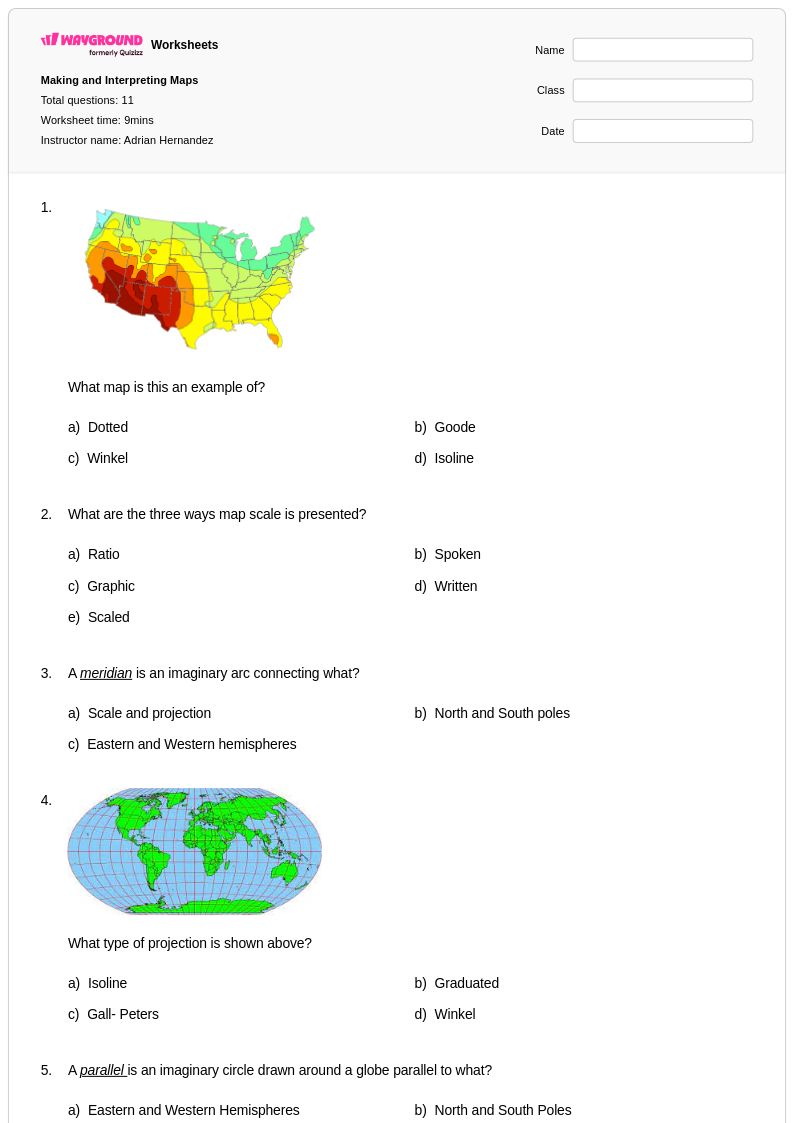
Effective practice tasks include side-by-side comparison activities where students analyze the same region across Mercator, Robinson, and Peters projections and identify what changes. Labeling exercises that ask students to mark where distortion is greatest, and short-answer prompts that require them to justify which projection is most appropriate for a given purpose, such as navigation versus thematic data display, build both analytical and applied skills.
How do map projection worksheets help students understand distortion?
Map projection worksheets provide structured opportunities for students to work through distortion concepts with guided practice problems, rather than relying on passive observation alone. Tasks that ask students to identify whether size, shape, distance, or direction is preserved or distorted in a given projection force them to engage with each property analytically. Regular exposure to these exercises builds the spatial reasoning skills that underpin geographic literacy.
How can I use map projections worksheets in my classroom?
Map projections worksheets on Wayground are available as printable PDFs for traditional classroom instruction and in digital formats for online or blended learning environments, and can also be hosted as a quiz directly on Wayground. Printable versions work well for guided note-taking, partner comparisons, or independent practice, while digital formats allow for quick whole-class review or self-paced work. Each worksheet includes a complete answer key, making them practical for both initial instruction and remediation.
How do I differentiate map projections instruction for students at different levels?
For students who need additional support, reduce the number of projections being compared at one time and focus first on the Mercator versus Robinson contrast before introducing additional types. Advanced students can be challenged to evaluate which projection is most appropriate for a specific real-world application and defend their reasoning in writing. On Wayground, teachers can apply accommodations such as read aloud, reduced answer choices, and extended time to individual students without affecting the rest of the class.