

Wayground
Making Informal Inferences - Printable ELA Worksheets class 7 - Wayground

Making Informal Inferences

Lance Knudson

Created by Lance Knudson

7 questions

7th Grade

ELA

Updated May 2025

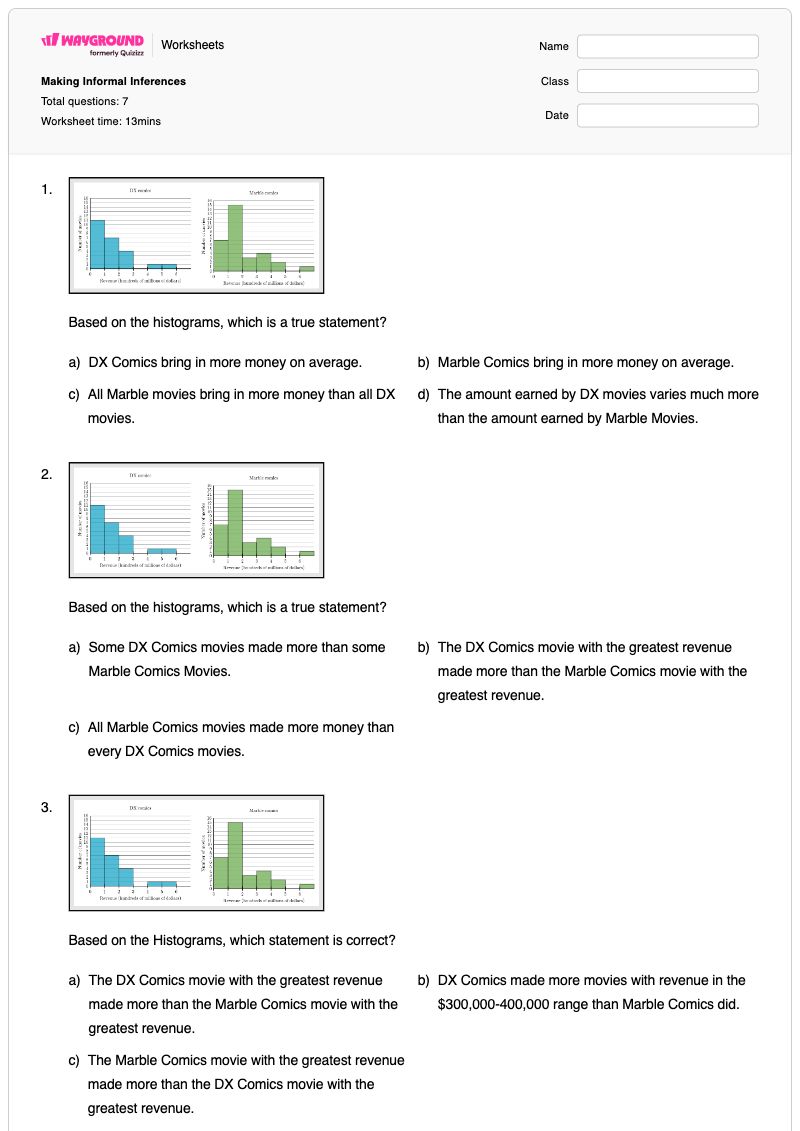
Making Informal Inferences is a Grade 7 mathematics worksheet that helps students interpret and compare data displays. The seven multiple-choice questions use histograms and box plots to ask students to identify differences in average or measure of center, recognize overlap between distributions, compare maximum and minimum values, and judge which data set varies more. Students must read evidence from the displays rather than rely on broad visual impressions or assume that one group consistently exceeds another. The histogram items focus on revenue comparisons for DX Comics and Marble Comics, including average, overlap, and greatest revenue. The box-plot items compare temperatures in St. Louis and Washington, D.C., including center, extremes, and spread. This free printable worksheet includes a complete answer key, making it suitable for guided practice, independent review, or a quick assessment of informal inference skills.

Worksheet settings

Font size

S
M
L
XL
WaygroundWorksheets

Making Informal Inferences

Total questions: 7

Name
Class
Date
1.
Based on the histograms, which is a true statement?

Based on the histograms, which is a true statement?

a)

DX Comics bring in more money on average.

b)

Marble Comics bring in more money on average.

c)

All Marble movies bring in more money than all DX movies.

d)

The amount earned by DX movies varies much more than the amount earned by Marble Movies.

2.
Based on the histograms, which is a true statement?

Based on the histograms, which is a true statement?

a)

Some DX Comics movies made more than some Marble Comics Movies.

b)

The DX Comics movie with the greatest revenue made more than the Marble Comics movie with the greatest revenue.

c)

All Marble Comics movies made more money than every DX Comics movies.

3.
Based on the Histograms, which statement is correct?

Based on the Histograms, which statement is correct?

a)

The DX Comics movie with the greatest revenue made more than the Marble Comics movie with the greatest revenue.

b)

DX Comics made more movies with revenue in the $300,000-400,000 range than Marble Comics did.

c)

The Marble Comics movie with the greatest revenue made more than the DX Comics movie with the greatest revenue.

4.
Based on the Box Plots, which statement is correct.

Based on the Box Plots, which statement is correct.

a)

The temperatures were higher on average in St. Louis

b)

The temperatures varied more noticeably in Washington, D.C.

c)

The temperatures had a higher measure of center in Washington, D.C.

d)

St. Louis had the hottest recorded temperature

5.
Based on the Box Plots, which statement is correct.

Based on the Box Plots, which statement is correct.

a)

Washington, D.C. had the hottest temperature recorded

b)

Washington, D.C. had the coldest temperature recorded

c)

The weather varied more in Washington, D.C.

d)

The temperatures had a higher measure of center in St. Louis

6.
Based on the Box Plots, which statement is correct.

Based on the Box Plots, which statement is correct.

a)

The hottest temperature was recorded in St. Louis

b)

St. Louis had the coldest temperature recorded

c)

The temperatures had a higher measure of center in St. Louis

d)

The lowest temperature was recorded in Washington, D.C.

7.
Based on the Box Plots, which statement is correct.

Based on the Box Plots, which statement is correct.

a)

The weather varied more in St. Louis

b)

The weather varied more in Washington, D.C.

c)

St. Louis had the hottest temperature recorded

d)

Washington D.C. had the coldest temperature recorded

WaygroundAnswer Key

Making Informal Inferences

Total questions: 7

1.
b)

Marble Comics bring in more money on average.

2.
a)

Some DX Comics movies made more than some Marble Comics Movies.

3.
c)

The Marble Comics movie with the greatest revenue made more than the DX Comics movie with the greatest revenue.

4.
c)

The temperatures had a higher measure of center in Washington, D.C.

5.
a)

Washington, D.C. had the hottest temperature recorded

6.
b)

St. Louis had the coldest temperature recorded

7.
a)

The weather varied more in St. Louis

FAQs

What does the Making Informal Inferences worksheet cover?

This Grade 7 worksheet develops students’ ability to make informal inferences by comparing histograms and box plots. Its seven multiple-choice questions require students to interpret average or measure of center, identify overlap, compare highest and lowest values, and determine which distribution has greater variability using revenue and temperature data.

How can I use this worksheet to teach students to make informal inferences?

First, have students identify what each display represents and discuss the difference between center, spread, overlap, and extreme values. Then use the histogram questions to model how to compare revenue distributions without claiming that every movie in one group outperformed every movie in the other, followed by the box-plot questions to compare temperatures in St. Louis and Washington, D.C. Ask students to point to the part of each display that supports their selected answer.

What mistakes should I watch for when students complete this worksheet?

Students may confuse a higher measure of center with a higher maximum or assume that one distribution is always greater when the histograms overlap. In the box-plot questions, watch for students mixing up center, variability, hottest temperature, and coldest temperature, or treating the position of one endpoint as evidence about the entire distribution.

How do I assign and grade this worksheet?

Making Informal Inferences is available as a printable PDF and as a digital quiz on Wayground, and it includes a complete answer key for all seven multiple-choice questions. You can grade printable submissions by scanning student work with the Wayground for Teachers app.

How can I differentiate this worksheet for my students?

Use the worksheet’s Advanced Settings to adjust font spacing or increase the font size so the histogram and box-plot prompts and answer choices are easier to read. You can also select a dyslexia-friendly font or translate the worksheet into another language while keeping its data-display comparison format.

Where can I find more worksheets like this on Wayground?

Wayground offers a broad collection of free printable worksheets and practice problems across subjects, with downloadable PDFs and answer keys to support essential skills and concepts. Browse more resources at https://wayground.com/en-us/worksheets.