
 Worksheets
1D Motion - All Targets
Total questions: 36
Worksheet time: 3hrs 30mins
Name
Class
Date
1.
Total distance divided by total time is
a)
average speed
b)
constant speed
c)
instantaneous speed
d)
acceleration
2.

Avery likes to walk 30 feet in 10 seconds. What is her speed?
a)
3 feet/sec
b)
6 feet/sec
c)
10 feet/sec
d)
2 feet/sec
3.
What is velocity?
a)
the quickness of an object
b)
the location of an object
c)
acceleration
d)
speed in a specific direction
4.
How far will a person go if they jog for 2 hours at a speed of 12 km/hr?
a)
6 km
b)
0.5 km
c)
10 km
d)
24 km
5.
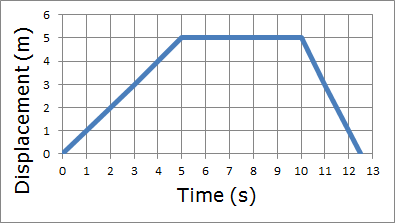
According to the graph how far does the person travel in the first 5 seconds?
a)
2 m
b)
10 m
c)
0 m
d)
5 m
6.
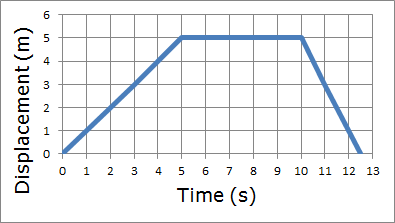
What is the person doing from 5 seconds to 10 seconds?
a)
Walking
b)
Running
c)
Standing Still
d)
Walking Fast
7.

How far is the person from the starting point after 3 seconds?
a)
0 m
b)
2 m
c)
3 m
d)
6 m
8.
When are you undergoing an acceleration in a car?
a)
speed up
b)
slow down
c)
make turns
d)
All of the above
9.

A drag racer accelerated from 0 m/s to 200 m/s in 5 s. What was the acceleration?
a)
0 m/s
b)
40 m/s2
c)
-40 m/s2
d)
40 m/s
10.
A car accelerates from a standstill to 70 m/s in 10 seconds. What is the acceleration?
a)
0.7m/s2
b)
7m/s2
c)
14m/s2
d)
none of the above
11.
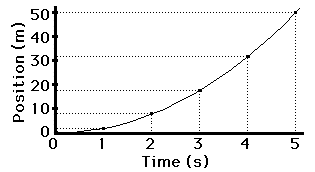
The picture of the position vs. time graph shows an object that is...
a)
accelerating/speeding up
b)
moving at a constant speed
c)
not moving
d)
accelerating/slowing down.
12.
In each of the following cases, determine where the car has no acceleration ?
a)
A car shortly after a stoplight turns green.
b)
A car approaching a red light
c)
A car with the cruise control set at 80 km/h
d)
A car turning a curve at a constant speed
13.
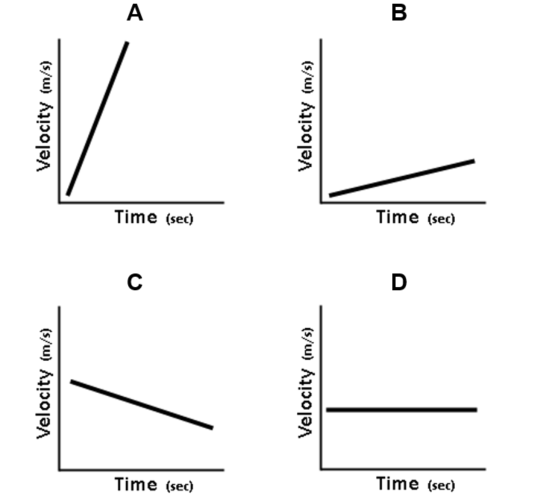
Which graph represents zero acceleration (constant velocity)?
a)
A
b)
B
c)
C
d)
D
14.

Which graph shows the object standing still?
a)
A
b)
B
c)
C
d)
D
15.
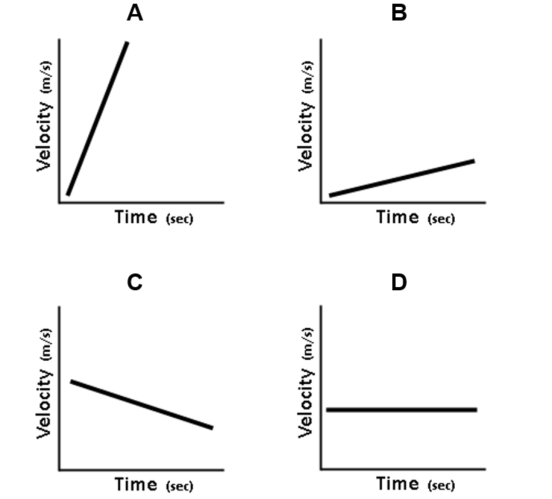
Which graph represents the greatest acceleration?
a)
A
b)
B
c)
C
d)
D
16.
If I walk 6 miles east then turn around and walk 8 miles west, what is my displacement?
a)
2 miles west
b)
2 miles east
c)
10 miles west
d)
10 miles east
17.
Bill runs 400 meters to Andy's house, turns around, and runs 400 meters back home. What is Bill's distance?
a)
0 meters
b)
400 meters
c)
800 meters
d)
1600 meters
18.

What is this graph showing?
a)
Constant Speed
b)
Acceleration (speeding up)
c)
Deceleration (slowing down)
d)
No motion
19.
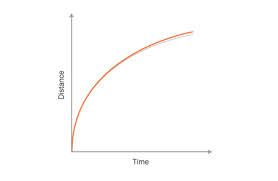
What is this graph showing?
a)
Constant Speed
b)
Acceleration (speeding up)
c)
Deceleration (slowing down)
d)
No motion
20.

How many times does this object STOP moving?
a)
None
b)
Once
c)
Twice
d)
Three times
21.

How far does the object move?
a)
40m
b)
80m
c)
100
d)
100m
22.

What kind of acceleration is shown here?
a)
positive
b)
negative
c)
none
d)
varies
23.

What kind of acceleration is shown here?
a)
positive
b)
negative
c)
none
d)
varies
24.

What kind of acceleration is shown here?
a)
none
b)
positive
c)
negative
d)
varies
25.

What is the velocity?
a)
not moving
b)
increasing
c)
positive
d)
negative
26.

What is the velocity?
a)
positive
b)
negative
c)
decreasing
d)
increasing
27.

What is the velocity?
a)
0 m/s
b)
positive m/s
c)
negative m/s
d)
decreasing
28.

Is the speed constant or non-constant?
a)
constant
b)
non-constant
29.

Is the speed constant or non-constant?
a)
constant
b)
non-constant
30.

Is the speed constant or non-constant?
a)
constant
b)
non-constant
31.

Is the speed constant or non-constant?
a)
constant
b)
non-constant
32.

Which section of the graph shows decreasing velocity?
a)
CD
b)
DE
c)
EF
d)
GH
33.

Which section of the graph shows increasing velocity?
a)
AB
b)
BC
c)
DE
d)
EF
34.
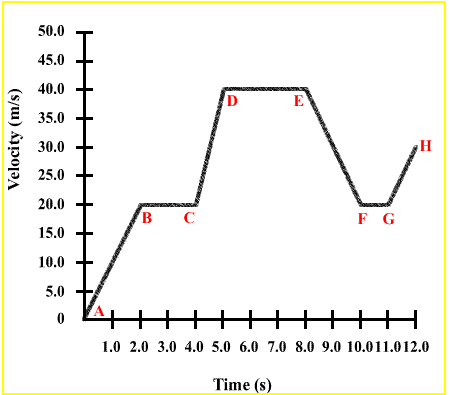
Which section of the graph shows constant velocity?
a)
AB
b)
BC
c)
EF
d)
GH
35.
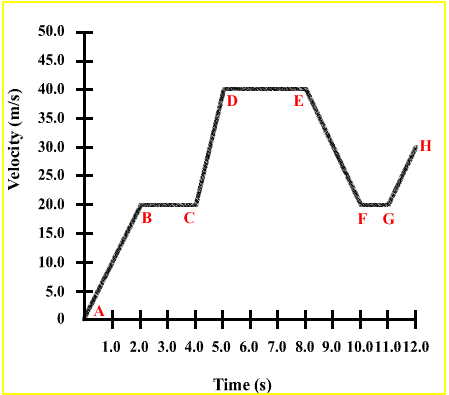
Which section of the graph shows acceleration?
a)
AB
b)
BC
c)
EF
d)
FG
36.

Which section of the graph shows deceleration?
a)
AB
b)
BC
c)
EF
d)
GH
100 %

