
 Worksheets
Graphs and Data
Total questions: 20
Worksheet time: 27mins
Name
Class
Date
1.

Which factor is the variable in this experiment?
a)
the type of bee
b)
the time of day
c)
the type of plant
d)
the color of the flowers
2.

Which of the following hypotheses could be tested by this experiment?
a)
Honeybees prefer to visit rose plants
b)
Honeybees prefer to visit red flowers.
c)
Honeybees prefer to visit flowers in the morning
d)
Honeybees prefer to visit Portland rose flowers between 9 and 10
3.

Which of the following is the BEST reason why the Portland rose plant is included in all of the groups to be studied?
a)
The type of plant is a control factor.
b)
The experiment will test whether bees prefer Portland rose over other roses.
c)
An experiment should have more than one variable.
d)
The Portland rose is a very common plant.
4.
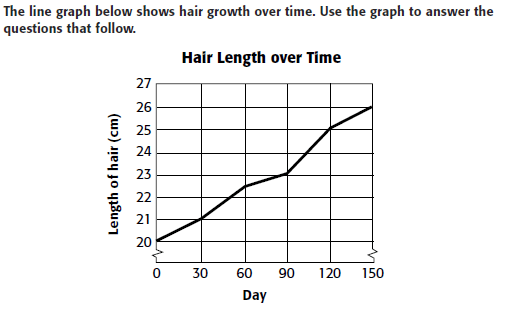
How long was the hair on day 60?
a)
20.0 cm
b)
21.0 cm
c)
22.5 cm
d)
23.0 cm
5.

On which day was hair length 23 cm?
a)
day 60
b)
day 90
c)
day 120
d)
day 150
6.

From day 0 to day 150, what is the average amount that hair grows every 30 days?
a)
0.5 cm
b)
1.2 cm
c)
1.5 cm
d)
2.0 cm
7.

What is the most likely explanation for the change seen after the two-minute mark?
a)
The person started exercising.
b)
The person fell asleep.
c)
The person inhaled.
d)
The person sat down.
8.

How much faster is the heart beating during minute 5 than during minute 2?
a)
10 beats per minute more
b)
12 beats per minute more
c)
15 beats per minute more
d)
17 beats per minute more
9.

A fever is a spike in temperature. On which day does this person have a fever?
a)
Sunday
b)
Monday
c)
Wednesday
d)
Saturday
10.

What is the highest temperature that this fever reaches?
a)
37
b)
38
c)
39
d)
40
11.

What is probably this person's normal body temperature?
a)
37
b)
38
c)
39
d)
40
12.
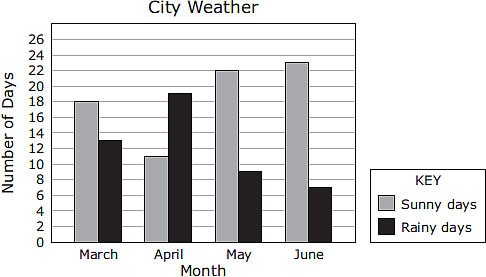
The graph below shows the number of sunny days and rainy days in a city during four months.
Based on the graph,how many more sunny days than rainy days did this city have during the months of April, May, and June?
Based on the graph,how many more sunny days than rainy days did this city have during the months of April, May, and June?
a)
21
b)
56
c)
26
d)
20
13.

What percentage of the days that it rained, did they forecast no rain?
a)
About 20%
b)
About 18%
c)
About 14%
d)
About 12%
14.

How many total students took the survey?
a)
10
b)
9
c)
11
d)
20
15.

Here distance stands for Bill's distance from Ridgewood. When was Bill not moving?
a)
Between 0 and 1 seconds
b)
Between 1 and 2 seconds
c)
Between 3 and 5 seconds
d)
Between 5 and 6 seconds
16.

How many students have blue for a favorite color?
a)
11
b)
12
c)
14
d)
17
17.

In August, how many metric tons did Clark's Paper Mill and Tyler Paper Mill produce all together?
a)
10
b)
70
c)
80
d)
90
18.

How many more 9th graders voted than 8th graders?
a)
75
b)
5
c)
155
d)
80
19.

How many people added hot sauce to their food on Monday?
a)
40
b)
20
c)
70
d)
80
20.

What percentage of the class has a goldfish, if students listed only ONE pet?
a)
About 18%
b)
About 23%
c)
About 6%
d)
About 13%
100 %

