
 Worksheets
4.2 Test
Total questions: 40
Worksheet time: 1hrs 7mins
Name
Class
Date
1.

What is the range of the data?
a)
4
b)
8
c)
6
d)
2
2.

There are 200 vegetable plants in a garden. How many of the vegetable plants are green beans?
a)
16
b)
24
c)
28
d)
32
3.

The team scored 80 points. How many points did Porter score?
a)
40 points
b)
32 points
c)
14.4 points
d)
12 points
4.

What is the total number of students surveyed?
a)
52
b)
54
c)
56
d)
20
5.

What is the median of the data?
a)
200
b)
100
c)
90
d)
140
6.

What is the minimum value?
a)
64
b)
58
c)
66
d)
60
7.

What data value is the upper quartile (Q3)?
a)
64
b)
62
c)
66
d)
58
8.

What value is the lower quartile?
a)
66
b)
58
c)
60
d)
64
9.

Find the Maximum
a)
14
b)
20
c)
5
d)
12
10.

Which day had more minutes of homework?
a)
Wednesday
b)
Thursday
c)
Friday
d)
Ms. Jones
11.

How many total people took the survey?
a)
50
b)
150
c)
100
d)
200
12.
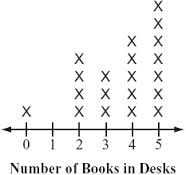
How many people have four books in their desks?
a)
2
b)
3
c)
4
d)
5
13.
What percentage does a whole circle graph represent?
a)
360%
b)
90%
c)
50%
d)
100%
14.

If there are 300 seventh graders, how many students prefer choir?
a)
96
b)
24
c)
75
d)
42
15.

How many students spent 7 hours doing homework that week?
a)
1
b)
3
c)
5
d)
6
16.
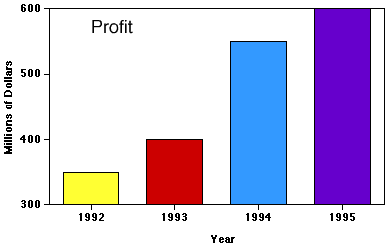
What is the best summary statement for this graph?
a)
Profits decreased in later years.
b)
Profits remained the same through the years.
c)
Profits increased through the years
17.

What is the difference between the highest score and the lowest score on the test?
a)
15
b)
100
c)
6
d)
10
18.

What is the range of the data?
a)
4
b)
8
c)
6
d)
2
19.

How many more students played soccer than football?
a)
3
b)
30
c)
6
d)
60
20.

There are 200 plants in a garden. How many of the plants are either cucumbers or peppers?
a)
9
b)
11
c)
32
d)
40
21.

Which fitness club has the greater range?
a)
Fun Fit
b)
Greg's Gym
c)
Neither
22.

What is the IQR (interquartile range) of Greg's Gym?
a)
10
b)
20
c)
30
d)
40
23.

What is the difference in medians?
a)
0
b)
25
c)
50
d)
75
24.

This is a picture of a
a)
Bar chart
b)
Pie chart
c)
Line chart
d)
Column chart
25.

This is a picture of a
a)
Bar chart
b)
Pie chart
c)
Line chart
d)
Column chart
26.

This is a picture of a
a)
Bar chart
b)
Pie chart
c)
Line graph
d)
Column chart
27.

Which sport did boy participate in the least?
a)
tennis
b)
crafts
c)
canoeing
d)
swimming
28.

What is the total number of road and tandem bikes sold?
a)
6
b)
7
c)
1
d)
5
29.

How many students take the bus to school?
a)
35
b)
20
c)
10
d)
15
30.

How many people voted for red as their favorite color?
a)
100
b)
2
c)
4
d)
9
31.

How many votes did reading receive?
a)
2
b)
4
c)
6
d)
8
32.

How many votes did reading and social studies receive together?
a)
9
b)
11
c)
13
d)
15
33.

How many total votes were collected?
a)
5
b)
10
c)
15
d)
20
34.

Which pizzeria has the second largest sales?
a)
Pizza House
b)
Domiano's Pizza
c)
Little Secrets Pizza
d)
Uncle John's Pizza
35.
Which day had more minutes of homework?
a)
Wednesday
b)
Thursday
c)
Friday
d)
Ms. Jones
36.
Find the mode of:
5, 15, 10, 12, 5
5, 15, 10, 12, 5
a)
10
b)
5
c)
No mode
d)
15
37.
What is the mode?
a)
# happening the most
b)
the average
c)
biggest - smallest
d)
the middle #
38.
In order to find the median, the data must be sorted from least to greatest first.
a)
True
b)
False
39.
3, 4, 5, 5, 5, 6,7
The range of these numbers is
The range of these numbers is
a)
15
b)
4
c)
2
d)
5
40.
Find the median of these numbers:
4,2,7,4,3
4,2,7,4,3
a)
2
b)
5
c)
7
d)
4
100 %

