
 Worksheets
S2 Math 1 Final
Total questions: 50
Worksheet time: 3hrs 57mins
Name
Class
Date
1.

What is the solution to this system?
a)
(1, -1)
b)
(-1, 1)
c)
(0, -2)
d)
(2, 0)
2.

When you graph the exact same equation twice,
a)
you will have no solution.
b)
you will have one solution.
c)
you will have infinite solutions.
d)
you will graph a giraffe.
3.
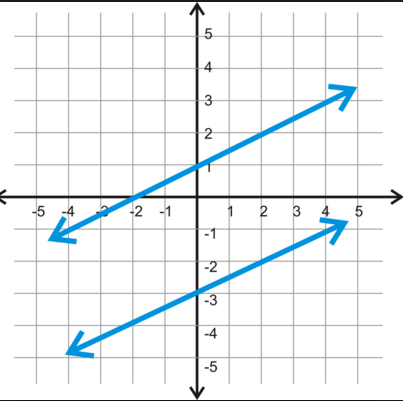
How many solutions will this system have?
a)
No solution
b)
One Solution
c)
I Don't Know
d)
Infinitely Many Solutions
4.
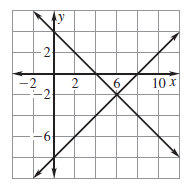
What is the solution to the system?
a)
(3, -1)
b)
(2, -6)
c)
No Solution
d)
(6, -2)
5.

Lesly graphed two lines in order to find the solution to a given system of equations.
What is the solution?
What is the solution?
a)
(-3,-8)
b)
(-8,-3)
c)
(3,-8)
d)
(8,3)
6.
What is the solution to this system?
y= 4x + 3
2x - 3y = 21
y= 4x + 3
2x - 3y = 21
a)
(3,-9)
b)
(-3,-9)
c)
(-3,9)
d)
(0,1)
7.
What is the solution to this system?
x= 7 - 2y
2x + y = 5
x= 7 - 2y
2x + y = 5
a)
(-1,4)
b)
(4,-1)
c)
(1,3)
d)
(3,1)
8.
What is the solution to this system?
y= -3x + 5
5x - 4y = -3
y= -3x + 5
5x - 4y = -3
a)
(2,-1)
b)
(-1,2)
c)
(1,2)
d)
(2,1)
9.
What is the solution to this system?
x - y = 6
y= 2x - 5
x - y = 6
y= 2x - 5
a)
(1,3)
b)
(-1,3)
c)
(-1,-7)
d)
(1,-7)
10.
Solve:
y = -1x - 5
4x - 8y = 4
y = -1x - 5
4x - 8y = 4
a)
(-3, -2)
b)
(5, -7)
c)
(3, 9)
d)
(-5, 4)
11.
x-y=11
2x+y=19
2x+y=19
a)
(10,-1)
b)
(-1,10)
c)
(3,-4)
d)
(6,7)
12.
Solve by elimination:
9x-4y=7
x-4y=-17
9x-4y=7
x-4y=-17
a)
(-1,5)
b)
(-7,5)
c)
(7,5)
d)
(3,5)
13.
Solve the system by elimination.
4x + 12y = −1
−3x − 9y = 0
4x + 12y = −1
−3x − 9y = 0
a)
(10, 1)
b)
(−10, −1)
c)
(10, −1)
d)
No solution
14.
Solve the system of Equation (Elimination Method)
5x + y = 9
10x − 7y = −18
5x + y = 9
10x − 7y = −18
a)
(-4,-1)
b)
(-1,-4)
c)
(4,1)
d)
(1, 4)
15.
Solve the system.
5x + 8y = -12
3x + 5y = -7
5x + 8y = -12
3x + 5y = -7
a)
(1, -10)
b)
No solution
c)
(-4, 1)
d)
(1, 10)
16.
What do you do to solve the graph of the inequality:
-2x ≤ 10
-2x ≤ 10
a)
divide by -2
b)
multiply by -2
c)
multiply by -2 and flip the inequality
d)
divide by -2 and flip the inequality
17.

Match the graph with its inequality.
a)
11 < a
b)
11 > a
c)
11 ≤ a
d)
11 ≥ a
18.
-2(x+2) < 14
a)
x < - 5
b)
x > -5
c)
x < -9
d)
x > -9
19.

Pick the correct letter for:
6 > x
6 > x
a)
A
b)
B
c)
C
d)
D
20.

What inequality does the number line graph represent?
a)
x + 4 ≤ -1
b)
2x - 3 < 7
c)
x - 1 ≤ 4
d)
2x + 3 >13
21.
All of the y values or outputs are called what?
a)
Domain
b)
Range
c)
Relation
d)
Function
22.
All of the x values or inputs are called what?
a)
Domain
b)
Range
c)
Relation
d)
Function
23.

a)
Function
b)
Not a Function
24.

a)
Function
b)
Not a Function
25.

a)
Function
b)
Not a Function
26.

a)
Function
b)
Not a Function
27.

What is the range of the following graph?
a)
-5, -1, 0 , 1, 5
b)
-4, -2, 0, 3, 6
c)
(-4, 1) ( 6, 0)
d)
(6, 0)
28.

a)
[0, ∞]
b)
[0, ∞)
c)
[-1, ∞]
d)
[-1, ∞)
29.

a)
[-1, ∞)
b)
[0, -1]
c)
[-1, ∞]
d)
[0, ∞)
30.

a)
(-2, 2)
b)
[-2, 2]
c)
[-3, ∞)
d)
(-∞, ∞)
31.

Determine the domain
a)
[-3, ∞)
b)
(-∞, ∞)
c)
[-3, 5]
32.

What color car is the least popular at this car dealership?
a)
Red
b)
White
c)
Blue
d)
Green
33.

Which age group liked Action movies the least?
a)
18-25
b)
25-49
c)
50+
d)
238
34.

According to the table, what is the relative frequency of students ages 10 - 13 who eat breakfast?
a)
About 33%
b)
About 50%
c)
About 40%
d)
About 44%
35.
The shelf life of a particular dairy product is normally distributed with a mean of 12 days and a standard deviation of 3 days.
About what percent of the products last between 12 and 15 days?
About what percent of the products last between 12 and 15 days?
a)
68%
b)
34%
c)
16%
d)
2.5%
36.
The shelf life of a particular dairy product is normally distributed with a mean of 12 days and a standard deviation of 3 days.
About what percent of the products last 6 days or less?
About what percent of the products last 6 days or less?
a)
68%
b)
34%
c)
16%
d)
2.5%
37.
The mean life of a tire is 30,000 km. The standard deviation is 2000 km.
Then, 68% of all tires will have a life between ___________ km and __________ km.
Then, 68% of all tires will have a life between ___________ km and __________ km.
a)
28,000 km and 32,000 km.
b)
24,000 km and 34,000 km.
c)
26,000 km and 34,000 km.
d)
27,000 km and 31,000 km.
38.
What shape is a normal distribution curve?
a)
Half curve
b)
Round curve
c)
Bell curve
d)
Square curve
39.
Between what two standard deviations of a normal distribution contain 68% of the data?
a)
one below and one above
b)
two below and two above
c)
two below and zero
d)
zero and two above
40.
What is the Normal Range (68%) of the annual precipitation for Phoenix, if the average is 29 with a standard deviation of 3?
a)
26-32
b)
3-29
c)
26-29
d)
39-32
41.
The distribution of heights of adult American men is approximately Normal with mean 69 inches and standard deviation 2.5 inches. Between what heights do the middle 95% of men fall?
a)
66.5-71.5
b)
64-74
c)
61.5-76.5
d)
65-73
42.
The distribution of heights of adult American men is approximately Normal with mean 69 inches and standard deviation 2.5 inches. What percent of men are between 64 and 66.5 inches tall?
a)
50%
b)
2.5%
c)
13.5%
d)
34%
43.

What percentage of the students were boys?
a)
20%
b)
25%
c)
40%
d)
50%
44.

How many women drive an SUV?
a)
180
b)
45
c)
156
d)
135
45.

How many people drive a sports car?
a)
60
b)
180
c)
84
d)
156
46.

What percentage of SUV's are driven by women?
a)
56.25%
b)
75%
c)
83.25%
d)
86.5%
47.

What percentage of males drive sports cars?
a)
35%
b)
16.25%
c)
65%
d)
25%
48.

Which box and whisker plot has the highest median?
a)
Top plot
b)
Bottom plot
49.

11. What percentage of the data is between 90 and 140?
a)
25 %
b)
50%
c)
75%
d)
100%
50.

What percent of the data is between 25 and 30 on the number line?
a)
25%
b)
`50%
c)
75%
d)
100%
100 %

