
 Worksheets
Types of Graphs
Total questions: 20
Worksheet time: 46mins
Name
Class
Date
1.
I have no axes at all. I help compare parts to a whole. What am I?
a)
Circle Graph
b)
Histogram
c)
Line Graph
d)
Bar Graph
2.
I only have an x-axis. I help to compare quantity and popularity. What am I?
a)
Circle Graph
b)
Histogram
c)
Line Graph
d)
Dot Plot
3.
I have an x-axis and a y-axis. I help to track changes over time. What am I?
a)
Circle Graph
b)
Histogram
c)
Line Graph
d)
Dot Plot
4.
I have an x-axis and a y-axis. I help to compare categories. There are spaces between my bars. What am I?
a)
Bar Graph
b)
Histogram
c)
Line Graph
d)
Dot Plot
5.
I have an x-axis and a y-axis. I help to show frequency. There are no spaces between my bars. What am I?
a)
Bar Graph
b)
Histogram
c)
Line Graph
d)
Dot Plot
6.

What type of graph is this?
a)
Bar Graph
b)
Pictograph
c)
Dot Plot
d)
Circle Graph
7.

What type of graph is this?
a)
Bar Graph
b)
Dot Plot
c)
Histogram
d)
Line Graph
8.

What type of graph is this?
a)
Line Graph
b)
Dot Plot
c)
Histogram
d)
Circle Graph
9.

What is the title of this graph?
a)
Numbers
b)
Dot Plot
c)
There is no title
d)
Hours Spent Doing Homework
10.
How many students spent 7 hours doing homework that week?
a)
1
b)
3
c)
5
d)
6
11.

What type of graph is this?
a)
Bar Graph
b)
Histogram
c)
Dot Plot
d)
Pie Graph
12.

What type of graph is this?
a)
Dot Plot
b)
Pie Graph
c)
Line Graph
d)
Histogram
13.

What is the title of this graph?
a)
School Transportation
b)
Bus
c)
No title
d)
Pie Graph
14.

What is this?
a)
Data Table
b)
Tape Diagram
c)
Histogram
d)
I don't know
15.

When would I use a graph like this?
a)
To see small changes over time
b)
To compare parts to a whole
c)
To compare categories
d)
To see frequency
16.

When would I use a graph like this?
a)
To see changes over time
b)
To compare parts to a whole
c)
To compare categories
d)
To see frequency
17.

Elliot says almost everyone arrived at the party after 10:00 P.M., but Nancy thinks most people came earlier. When did a most of the people arrive?
a)
7:00-7:59 P.M.
b)
8:00–8:59 P.M.
c)
9:00–9:59 P.M.
d)
10:00–10:59 P.M.
18.

When would I use a graph like this?
a)
To show changes over time
b)
To compare quantity or popularity
c)
To compare parts to a whole
d)
To show frequency
19.
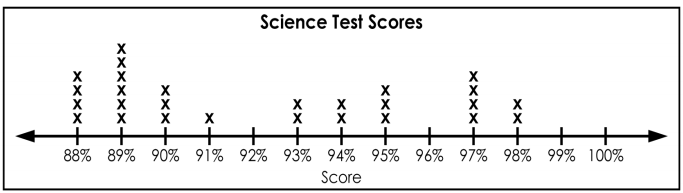
How many more students scored a 88 than scored a 98?
a)
4
b)
2
c)
6
d)
35
20.

What is this graph missing?
a)
Axes
b)
Title
c)
Categories
d)
None of these
100 %

