
Font size
S
M
L
XL
 Worksheets
AP Statistics Fall Exam Review - Schlosser
Total questions: 87
Worksheet time: 7hrs 15mins
Name
Class
Date
1.

Describe the shape of the graph.
a)
Skewed right
b)
Skewed left
c)
Uniform
d)
Symmetrical
2.
In order to perform an experiment using a random sample of 60 members of a gym, I first divide the list of members into men and women because I feel that the results will be different based on gender. I then randomly choose 30 men and 30 women. I assign half of the men to the treatment group and half to the control group. I repeat this procedure with the women. This is an example of a:
a)
randomized design
b)
blocking design
c)
stratified sample
d)
double blind simple random sample
3.
Which of the following is not necessary to all experiments?
a)
treatment
b)
replication
c)
randomization
d)
blocking
4.
Which of the following is not true about a simple random sample?
a)
Every member of the population has an equal chance of being selected
b)
Every subset of a population has an equal chance of being selected
c)
The population should be put in numerical order before selecting the sample
d)
the population should be divided into groups based on similar characteristics before selecting the sample
5.
What type of correlation describes the following sentence:
The temperature outside and the number of hot chocolate sold at a football game.
The temperature outside and the number of hot chocolate sold at a football game.
a)
postive
b)
negative
c)
there is no correlation
6.

What type of association does this graph show?
a)
Positive
b)
negative
c)
none
d)
all of the above
7.

Interpret the slope of the Least Squares Line Equation.
a)
Income increases by 31.45 with each additional hour worked.
b)
Income increases by 31.45
c)
As hours increases by one, income will increase by 31.45, on average
d)
As hours increases by one, income will increase by 31.45
8.

What is the slope of the LSRL from this printout?
a)
0.74
b)
-0.47
c)
1.098
d)
23.59
9.
How do you calculate a residual?
a)
Observed Y - Predicted Y
b)
Predicted Y - Observed Y
c)
Square the standard deviations
d)
PANIC!
10.

Which value of r below is closest to the true r for this relationship?
a)
0.9
b)
0.5
c)
-0.9
d)
Cannot be determined
11.
A regression analysis of life expectancy vs number of televisions gives an r=.88 and a residual plot that shows no pattern. Because of these we can say...
a)
More televisions cause longer life expecatncy
b)
Longer life expectancy causes the sale of more televisions
c)
There is a positive association between life expectancy and number of televisions
d)
No conclusions can be made based on this information
12.
The measure of the strength, direction and form of the linears association can be measured by:
a)
coefficient of determineation (r2)
b)
correlation coefficient (r)
c)
linear regression
d)
S
13.
What tells you the number of standard deviations above or below the mean an observation is?
a)
standard error
b)
z-score
c)
68-95-99.7 Rule
d)
S
14.
IF P(A and B) = P(A)P(B) then A and B are...
a)
Disjoint
b)
Disjoint and Independent
c)
Mutually Exclusive
d)
Independent
15.
When two events cannot occur simultaneoutsly, they are:
a)
Independent
b)
Independent and Disjoint
c)
Disjoint
d)
Neither
16.
In a particular game, a fair die is tossed. If the number of spots showing is either 4 or 5 you win $1, if the number of spots showing is 6 you win $4, and if the number of spots showing is 1, 2, or 3 you win nothing. Let X be the amount that you win.
Which of the following is the expected value of X?
Which of the following is the expected value of X?
a)
$1.00
b)
$2.50
c)
$4.00
d)
$6.00
17.
The weight of written reports produced in a certain department has a Normal distribution with mean 60 g and standard deviation 12 g. The probability that the next report will weigh less than 45 g is...
a)
.1056
b)
.3944
c)
.1042
d)
.8944
18.
Which of the following random variables is NOT continuous?
a)
Amount of gasoline in a car.
b)
Time it takes to commute to work.
c)
Number of goals scored by a hockey team.
d)
Lifetime of a AAA battery.
19.
Mrs. H has invented a game involving two ten-sided dice. One die has threes, fours, and fives, the other has sixes, eights, and tens. I won’t tell you how many of each number there are on each, but I do tell you that if X = the result of a single roll of the 1st die and Y = the result of a single roll of the 2nd, then μx=3.6, σx=0.8, μy=8.0 and σy=0.9. Let Z = the sum of the two dice when each is rolled once. What is the expected value of Z?
a)
1.7
b)
4.4
c)
5.8
d)
11.6
20.
Mrs. H has invented a game involving two ten-sided dice. One die has threes, fours, and fives, the other has sixes, eights, and tens. I won’t tell you how many of each number there are on each, but I do tell you that if X = the result of a single roll of the 1st die and Y = the result of a single roll of the 2nd, then μx=3.6, σx=0.8, μy=8.0 and σy=0.9. Let Z = the sum of the two dice when each is rolled once. What is the standard deviation of Z?
a)
1.20
b)
1.30
c)
1.45
d)
1.70
21.
In a certain game of chance, your chances of winning are 0.2. If you play the game five times and outcomes are independent, which of the following represents the probability that you win at least once?
a)
(0.2)5
b)
1-(0.2)5
c)
1-(0.8)5
d)
(5C2)(0.2)(0.8)4
22.
A poll shows that 60% of the adults in a large town are registered Democrats. A newspaper reporter wants to interview a local democrat regarding a recent decision by the City Council. If the reporter asks adults at random, what is the probability that he will find a Democrat by the time he has stopped three people?
a)
.936
b)
.216
c)
.144
d)
.096
23.
Is this binomial experiment? Shuffle a deck of 52 cards. Turn over the top card. Put the card back in the deck, shuffle again. Repeat the process 10 times. Let X = the number of aces you observe.
a)
Yes
b)
No, the trials are not independent.
c)
No, there are more than 2 outcomes
d)
Yes, because the I keep going until I find the ace.
24.
An AP Statistics test has 6 multiple choice questions with four choices with one correct answer each. If we just randomly guess on each of the 6 questions, what is the probability that you get exactly 3 questions correct?
a)
0.962
b)
0.132
c)
0.831
d)
0.250
25.

Is the distribution below a probability distribution? Why or why not?
a)
Yes. All P(x) values are between 0 and 1, and ∑P(x) = 1
b)
No, not all P(x) values are between 0 and 1.
c)
No, ∑P(x) ≠ 1.
26.
In a NORMAL distribution, what percent of all values are within 1 standard deviation of the mean?
a)
95
b)
68
c)
99.7
d)
34
27.
If a sample of people were asked how many hours of TV they watched in a typical week, what shape would the data distribution be expected to have?
a)
Unimodal
b)
Right skewed
c)
Left skewed
d)
bimodal
28.
In a right-skewed distribution, which of the following is true?
a)
The mean tends to be less than the median.
b)
The mean tends to be greater than the median
c)
The mean and median are approximately the same
d)
None of these
29.

What is the shape of this distribution?
a)
Symmetrical
b)
Skewed right
c)
Geometric
d)
Skewed left
30.
Find the z-score for the age of a 36 year old if the mean is 28.1 and the standard deviation is 3.4
a)
1.73
b)
2.32
c)
2.33
d)
1.37
31.
The collection of information from the whole population.
a)
Population
b)
Census
c)
Sample
d)
Survey
32.

P(male | left-handed) =
a)
5/6
b)
6/11
c)
5/11
d)
6/46
33.

P(Male or right-handed) =
a)
70%
b)
38/75
c)
44/75
d)
70/75
34.

P(female and right-handed)=
a)
69/75
b)
23/75
c)
23/61
d)
23/29
35.

Which is true?
a)
Median > Mean
b)
Median ≈ Mean
c)
Median < Mean
36.

What is the IQR of this data?
a)
3
b)
7
c)
2
d)
1
37.

What is the upper (3rd) quartile?
a)
15
b)
16
c)
18
d)
20
38.

What percent is above 134 if mean=130 and SD=3?
a)
0.116
b)
0.909
c)
0.091
d)
0.045
39.

What percent is between 129 and 136 if mean=130 and SD=3?
a)
0.452
b)
0.608
c)
0.392
d)
0.631
40.

What is the z-score for 125 if mean=130 and SD=3?
a)
1.667
b)
-1.667
c)
2.667
d)
-2.667
41.
Approximately what percent of a normal distribution is within 2 Std. Dev's. of the mean?
a)
95%
b)
68%
c)
99%
d)
99.99%
42.
If r-squared = 0.64 for two quantitative variables, then the correlation is 0.8
a)
True
b)
False
c)
Maybe
43.
The percent of variation in the response variable that is explained by the model on the explanatory variable.
a)
r
b)
residual
c)
r-squared
d)
standard error of slope
44.
The amount of y-change for every additional unit increase in x.
a)
y-intercept
b)
slope
c)
residual
d)
standard error of slope
45.
A SRS of three 2nd grade classrooms from all 2nd grade classrooms in a school district.
a)
cluster
b)
stratified
c)
systematic
d)
multistage
46.
Any systematic error found in a sample.
a)
bias
b)
variation
c)
sampling error
d)
sampling variation
47.
A university only accepts students that score in the top 8% on their entrance exam. If the average score on the exam is 235 with a standard deviation of 28, what score must you exceed to be accepted into the university?
a)
261
b)
196
c)
238
d)
275
48.
The least squares regression line for a set of points is given as
y-hat = 2.5 + .54x. What is the residual for the point (5,6)
y-hat = 2.5 + .54x. What is the residual for the point (5,6)
a)
.8
b)
-.8
c)
.2
d)
.-2
49.
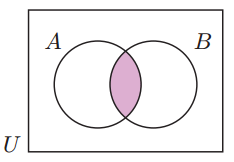
What statement does the shaded region represent?
a)
A or B
b)
Not A
c)
A and B
d)
Not B
50.
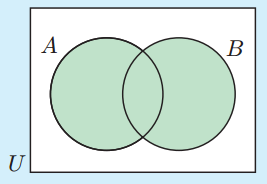
What statement does the shaded region represent?
a)
A or B
b)
A and B
c)
A
d)
B
51.

The image represents which of the following?
a)
"and"
b)
"or"
52.

The image represents which of the following?
a)
"and"
b)
"or"
53.
A set of all possible outcomes is known as -
a)
a list
b)
a complement
c)
a sample space
d)
an event
54.
A die is loaded so that the number 6 comes up three times as often as any other number. What, then, is the probability of rolling a 6?
a)
.125
b)
.375
c)
.500
d)
.250
55.
If I toss a fair coin five times and the outcomes are TTTTT, then the probability that tails appears on the next toss is
a)
0.5.
b)
less than 0.5.
c)
greater than 0.5.
d)
0.
56.
Which of the following is closest to the 61st percentile of a standard Normal distribution?
a)
z = –0.7291
b)
z = – 0.2793
c)
z = 0.2793
d)
z = 0.7291
57.

a)
Median = B; Mean = C
b)
Median = C; Mean = C
c)
Median = A; Mean = B
d)
Median = B; Mean = A
58.

a)
120 grams
b)
140 grams
c)
170 grams
d)
160 grams
59.

a)
The mean is larger than the median.
b)
The proportion of outcomes between 0.2 and 0.5 is equal to 0.3.
c)
The proportion of outcomes greater than 1.5 is equal to 0.25.
60.
The weights of cockroaches living in a university dormitory follow a Normal distribution with mean 80 grams and standard deviation 5 grams. The percentage of cockroaches having weights between 72 grams and 88 grams must be
a)
less than 68%.
b)
between 68% and 95%.
c)
between 95% and 99.7%.
61.
An office uses two brands of fluorescent light bulbs in its overhead light fixtures. From past experience, it is known that Brand A bulbs have a mean life length of 3000 hours and a standard deviation of 200 hours, while Brand B bulbs have a mean life length of 2700 hours and a standard deviation of 250 hours. Which bulb has a longer life relative to all bulbs of its brand, a Brand A bulb that lasts 3150 hours or a Brand B bulb that lasts 2850 hours?
a)
The Brand A bulb has a longer life relative to its brand.
b)
The Brand B bulb has a longer life relative to its brand.
c)
The two bulbs have equally long lives.
62.
What is the 25th percentile of the standard Normal distribution?
a)
1.00
b)
0.5987
c)
–0.67
d)
-1.00
63.
The lifetime of 9-volt battery in constant use has an approximately Normal distribution with a mean of 516 hours and a standard deviation of 20 hours. Which of the following best describes the distribution of standard scores for the lifetimes of such batteries?
a)
Exactly Normal, with mean 0 and standard deviation 1.
b)
Approximately Normal, with mean 0 and standard deviation 1.
c)
Approximately Normal, with mean 1 and standard deviation 1.
64.

a)
4
b)
5
c)
6
d)
7
65.
Scores on the American College Testing (ACT) have a mean of 18 and standard deviation of 6. Lisa’s standardized score on the ACT was z = -0.7. What was her actual ACT score?
a)
5.4
b)
13.8
c)
22.2
d)
25.4
66.
One of the values in a normal distribution is 43 and its z-score is 1.65. If the mean of the distribution is 40, what is the standard deviation of the distribution?
a)
-1.82
b)
0.55
c)
1.82
d)
-0.55
67.

a)
The median house price in Dublin is higher than the 75th percentile of house price in Westerville.
b)
The mean house price in Dublin is about $100,000 higher than the mean in Westerville.
c)
Half of the houses sold in Westerville cost less than the cheapest 25% of houses in Dublin.
d)
The range of prices in Dublin was about 1.5 times the range of prices in Westerville.
68.
Uses adjacent bars to show the distribution of a quantitative variable.
a)
Pie Chart
b)
Bar Graph
c)
Histogram
d)
Timeplot
69.
The place in the distribution of a variable that you'd point to if you wanted to attempt the impossible by summarizing the entire distribution with a single number. Includes the mean and the median.
a)
Center
b)
Spread
c)
Gap
d)
Mode
70.
A one dimensional plot of a quantitative data set where each value in the data set is represented by a dot above its corresponding location on the x axis.
a)
Stem-and-leaf Display
b)
Dotplot
c)
Histogram
d)
Bar chart
71.
Having one mode
a)
Unimodal
b)
Multimodal
c)
Bimodal
d)
Uniform Distribution
72.
Systematically recorded information, whether numbers or labels, together with it's context.
a)
Case
b)
Variable
c)
Subject
d)
Data
73.
A human experimental unit. (participant)
a)
Subject
b)
Case
c)
Identifier Variable
d)
Variable
74.
What does the following represent?
Random sample of 100 students from each grade level at a high school to complete a survey.
Random sample of 100 students from each grade level at a high school to complete a survey.
a)
SRS
b)
blocking
c)
stratified random sample
d)
experiment
75.
The events, black card and red card are an example of __________ because together they represent the entire sample space.
a)
independent events
b)
complementary events
c)
binomial distribution
d)
geometric distribution
76.
Undercoverage, nonresponse, and voluntary response are examples of what?
a)
Sampling Distribution
b)
Bias
c)
Type I error
d)
Type II error
77.
A value found by subtracting the mean and dividing by the standard deviation.
a)
Standardized Value
b)
Statistic
c)
Rescale
d)
Normal Probability Plot
78.
In a normal model about 68% of the data fall within 1 standard deviation of the mean, about 95% fall within 2 standard deviations of the mean, and about 99.7% falls with 3 standard deviations of the mean.
a)
Nearly Normal Condition
b)
68-95-99.7 Rule
c)
Normality Assumption
d)
z-score
79.
A region of the distribution where there are no values
a)
Hole
b)
Outlier
c)
Space
d)
Gap
80.
A distribution that is roughly flat
a)
Symmetric
b)
Uniform
c)
Multimodal
d)
Skewed
81.

a)
a
b)
b
c)
c
d)
d
82.

a)
a
b)
b
c)
c
d)
d
83.

a)
a
b)
b
c)
c
d)
d
84.

a)
a
b)
b
c)
c
d)
d
85.

a)
a
b)
b
c)
c
d)
d
86.

a)
a
b)
b
c)
c
d)
d
87.

a)
a
b)
b
c)
c
d)
d
Reset

