wayground logo

Free Printable Worksheets

NEW

Font size

S
M
L
XL
Worksheets

Chapter 6 - Linear Equations

Total questions: 45

Worksheet time: 57mins

Name
Class
Date
1.

In slope-intercept form (y= a+bx) what is the "b"?

a)

The y-intercept

b)

The x-intercept

c)

The gradient (rate of change)

d)

A point

2.

In slope intercept form (y= a+bx) what is the "a"?

a)

The y-intercept

b)

The x-intercept

c)

The slope (rate of change)

d)

A point

3.

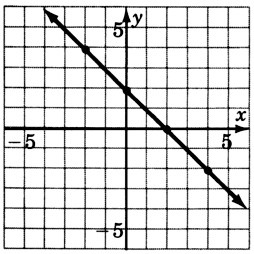
Which equation represents the following graph?

a)

y = 2+ 3x

b)

y = 3 - 2x

c)

y = 3 + 2x

d)

y = 2 - 3x

4.

What is the y-intercept in the equation?

y = -4 + 5x

a)

5

b)

-4

c)

-5

d)

4

5.

What is the y-intercept in the equation?

y = 8 - (2/3)x

a)

-8

b)

8

c)

-2/3

d)

4

6.

Find the equation of the line in slope-intercept form.

a)

y = -3 - 1/4x

b)

y = 3 + 1/3x

c)

y = 2 - 1/4x

d)

y = -3 + 1/3x

7.
Find the slope
a)
-5/3
b)
-3/5
c)
5/3
d)
3/5
8.
What is the y-intercept for the given graph?
a)
-5
b)
5
c)
1
d)
-1
9.
Find the slope of the line that passes through the points (2, 4) and (6, 12)
a)
1/2
b)
-1/2
c)
2
d)
-2
10.
Find the slope of the line that passes through
(10, 1) and (5, 2)
a)
1/5
b)
-1/5
c)
5
d)
-5
11.
Find the slope of the line.
a)
1/2
b)
-1/2
c)
2
d)
-2
12.

Which is the graph of y=2 -x?

a)

A

b)

B

c)

C

d)

D

13.

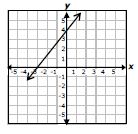
Which equation is being represented by this line?

a)

y = 2 -1x

b)

y = 2 + 1/2x

c)

y = -4 + 3x

d)

y = 2 - 3x

14.
Identify the y-intercept for the function:
y=-3x
a)
-3
b)
0
c)
1
d)
-1
15.

What is the slope of the equation?

y = 4 - 3x

a)

-3

b)

4

c)

-4

d)

3

16.

Given the equation y = 3 + 2x, what is the slope?

a)

2

b)

x

c)

3

d)

y

17.

Which of the following is in slope-intercept form?

a)

y=-7 + 10x

b)

y-5=3(x-1)

c)

5x-y=12

d)

6x+2y-15=0

18.

Find the gradient between the points

(8, 5) and (-9, 5)

a)

Zero

b)

Undefined

c)

-10/17

d)

-10/1

19.
Find the slope between the points
(-4, 3) and (-4, -7)
a)
5/4
b)
-10/8
c)
Zero
d)
Undefined
20.

Find the gradient between the points

(9, 7) and (13, 14)

a)

-4/7

b)

2/1

c)

Zero

d)

7/4

21.

A fitness club opens with 80 members. Each month the membership increases by 15 members. Which equation represents the relationship between the number of months the club has been opened, x, and the total fitness club membership, y?

a)

y=15x

b)

y=80+15x

c)

y=15+x

d)

y=15+ 80x

22.
What is the y-intercept of the line graphed below?
a)
3
b)
4
c)
-3
d)
4/3
23.

Which equation best represents the relationship between x and y in the table shown?

a)

y= 5 + 5x

b)

y=5 + 1/5x

c)

y=5 + 15x

d)

y=5+ 10x

24.
What does the graph of y =7 look like?
a)
A horizontal line 7 units below the x-axis.
b)
A vertical line 7 units to the right of the y-axis.
c)
A vertical line 7 units to the left of the y-axis.
d)
A horizontal line 7 units above the x-axis
25.
What does the graph of x = -5 look like?  
a)
A horizontal line 5 units below the x-axis.
b)
A vertical line 5 units to the right of the y-axis.
c)
A vertical line 5 units to the left of the y-axis.
d)
A horizontal line 5 units above the x-axis.
26.
The scatter plot shows the relationship between the number of chapters and the total number of pages for several books.  Use the trend line to predict how many chapters would be in a book with 180 pages. 
a)
12 chapters
b)
15 chapters
c)
18 chapters
d)
21 chapters
27.

Based on the line of best fit, about how many guests should be expected if the temperature is around 80 degrees?

a)

8,300

b)

7,300

c)

8

d)

9,300

28.

Use the line of best fit to approximate rate of change relative to the scatter plot above.

a)

7/5

b)

5/7

c)

-7/5

d)

-5/7

29.

The equation of the line of best fit

is y= 1 + 1/2x.

How many laps can a bicycle make around the park in

23 minutes?

a)

44 laps

b)

12 1/2 laps

c)

23 laps

d)

55 laps

30.

Students in a group of chess teams submitted data about hours of team practice and the number of matches the team won. The graph shows the results of the data. Based on the line of best fit equation y =3.52 + 3.14x, if a team practices 4.5 hours per week next year, which is the best prediction of the number of chess matches a team could expect to win?

a)

about 24

b)

about 12

c)

about 8

d)

about 18

31.

Adrianna has $20 in her savings account. Each week she will add $5 to it. Which equation represents this situation?

a)

y=25x

b)

y= 5 + 20x

c)

y=20 + 5x

d)

y=5x

32.
What is a line of best fit used for?
a)
To make predictions
b)
To make the graph look pretty
c)
To connect the points
33.
Select the statement that best describes the line.
a)
The line is the line of best fit.
b)
The line is NOT a line of best fit because it does not pass through two points.
c)
The line is NOT a line of best fit because it does not go through the middle of the data set.
d)
The line is NOT a line of best fit because it does not go through the origin.
34.
What is the best prediction for the number of candies in the jar when 30 students visit her?
a)
90
b)
180
c)
135
d)
150
35.
Predicting the number of days to finish when you read 40 pages is an example of:
a)
Interpolation
b)
Extrapolation
c)
An outlier
36.
Predicting the band grade after 3.5 hours of practice is an example of:
a)
Interpolation
b)
Extrapolation
c)
An outlier
37.
This means to predict a value inside the known values on a graph.
a)
trend line
b)
interpolation
c)
extrapolation
d)
causation
38.
This means to predict a value outside the known values on a graph.
a)
trend line
b)
interpolation
c)
extrapolation
d)
causation
39.
Predicting the attendance given a ticket price of $27.50 is an example of:
a)
Interpolation
b)
Extrapolation
c)
An outlier
40.

What are the coordinates of the y-intercept of the trend line?

a)

(0, 0)

b)

(0, 20)

c)

(0, 100)

d)

(100,0)

41.

What is the gradient of the line?

a)

$1 per day

b)

$1 per week

c)

$20 per day

d)

$20 per week

42.

Determine the equation of the line.

a)

y = 1x

b)

y = 100 + 1x

c)

y = 20x

d)

y = 100 + 20x

43.
What is f when x equals 4?
a)
-5
b)
0
c)
3
d)
6
44.

For the piecewise graph, when t=5, C=

a)

80

b)

100

c)

200

d)

180

45.

Water is being pumped into a tank. The graph shows the volume of water in a tank V (litres) after t minutes. The rate at which water is being pumped into the tank is closest to:

a)

40

b)

60

c)

80

d)

120