wayground logo

Free Printable Worksheets

NEW

Font size

S
M
L
XL
Worksheets

Thinking like a Scientist

Total questions: 45

Worksheet time: 35mins

Name
Class
Date
1.
This variable in an experiment is the one being deliberately changed by the scientist. 
a)
dependent variable
b)
independent variable
c)
data
d)
control group
2.
There are two types of data. Which type of data involves numbers that are obtained by counting or measuring?
a)
quantitative
b)
qualitative
3.
There are two types of data. Which type of data involves descriptions/photographs/illustrations that cannot be counted or measured?
a)
qualitative
b)
quantitative
4.
The summary at the end of an experiment that explains the results. 
a)
conclusion
b)
procedures
c)
materials
d)
responding variable
5.
A series of steps used by scientists to solve a problem or answer a question. 
a)
scientific method
b)
recipe
c)
data collection
d)
metric system
6.
In a controlled experiment, how many independent variables can be worked with at a time? 
a)
one
b)
none
c)
two or more
d)
how ever many makes sense.
7.
A list of the steps anyone could follow to conduct an experiment. 
a)
obervations
b)
question/problem
c)
materials
d)
procedures
8.
Measuring the number of times a person breathes after exercise involves ____ data. 
a)
quantitative
b)
qualitative
9.
Jane Goodall video recorded chimpanzees hunting pigs, this type of data is called ___
a)
qualitative
b)
quantitative
c)
field study
d)
observation
10.
Mr. S. sets up an experiment to see how the mass of a ball affects the distance it rolls off a ramp.  Identify the independent variable.
a)
distance traveled by the ball
b)
height of the ramp
c)
mass of the ball
d)
weight of the ball
11.
A student is planning an experiment to find out how the height from which he drops a ball affects how high the ball bounces. The dependent variable is the _____.
a)
Diameter of the ball
b)
Force acting on the ball
c)
Height that the ball bounces
d)
Height from which the ball is dropped
12.
If I study for my scientific method quiz, then I will have a better test score. What is the dependent variable?
a)
Scientific Method
b)
Studying
c)
Independent variable
d)
Test score
13.
This part of the experiment serves as a basis of comparison; the one variable being tested has been omitted. 
a)
experimental group
b)
control group
c)
data
d)
variables
14.
Which measurement is found when using a triple beam balance?
a)
pounds
b)
temperature
c)
yards
d)
grams
15.
In which science tool would you measure in ML (milliliters)?
a)
beaker and graduated cylinder
b)
beaker and ruler
c)
graduated cylinder and meter stick
d)
triple beam balance
16.
This tool can measure in Celsius or Fahrenheit....
a)
speed gauge
b)
ruler
c)
glassware
d)
thermometer
17.
microscopes would be useful for looking at...
a)
blood cells
b)
cows
c)
candy
d)
criminals
18.
What is this scientific tool?
a)
beaker
b)
tube
c)
graduated cylinder
d)
balance
19.

The curve on the surface of water in a graduated cylinder is called a(n)

a)

edge.

b)

meniscus.

c)

scale.

d)

linear adjustment.

20.

What SI base unit is used to measure length?

a)

meter

b)

kilometer

c)

centimeters

d)

hectometers

21.

What is the measurement in the picture?

a)

290.02 g

b)

291 g

c)

292 g

d)

290.2 g

22.

If a piece of equipment is not working properly, stop, turn it off, and tell

a)

your best friend in class.

b)

your lab partner

c)

the teacher.

d)

the principal.

23.

Horseplay, practical jokes, or pranks in the classroom are

a)

not dangerous.

b)

okay if you are working alone.

c)

always against the rules.

d)

okay.

24.

Before you leave the science room, you should

a)

wash your hands with soap and water.

b)

return all equipmernt to the proper storage area.

c)

clean your work area and equipment.

d)

all of the above.

25.
Hot glass looks the same as cold glass.
a)
True
b)
False
26.

What does the symbol represent?

a)

Heating safety

b)

Sharp objects

c)

Chemical safety

d)

Electrical safety

27.

Which of the following applies to this symbol?

a)

Handle animals carefully

b)

Do not eat or drink in the lab

c)

Never point sharp objects towards you

d)

Make sure hands are dry when plugging in electronics

28.

When do you wear safety goggles?

a)

When working with chemicals

b)

When working with heat

c)

When working with projectiles

d)

All of the above

29.
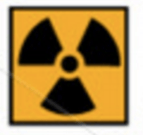
What safety symbol is this? 
a)
biohazard
b)
radiation
c)
toxic
d)
corrosive
30.
What does this symbol indicate?
a)
Corrosive substances are present; protect your hands.
b)
Wash your hands.
c)
Extreme temperatures are present; wear appropriate gloves.
d)
Bacteria are present.
31.
What safety symbol is this? 
a)
corrosive
b)
toxic
c)
radiation
d)
biohazard
32.
What safety symbol is this?
a)
Flammable 
b)
Oxidizing Agent
c)
No Open Flame
d)
Explosion
33.
a)
Poison
b)
Bio Hazard
c)
Environmental Hazard
d)
Not Drinking Water
34.
You should never ______ chemicals in the lab. 
a)
taste
b)
touch
c)
smell
d)
all of the above
35.
Which is NOT a step in the scientific method?
a)
Make observation
b)
Form a theory
c)
Collect data
d)
Form a hypothesis
36.
When in the lab you should wear...
a)
open-toed shoes.
b)
sandals.
c)
closed-toes shoes.
d)
no shoes.
37.
True or False: Your hypothesis can never be wrong.
a)
True
b)
False
38.
True or False: Your hypothesis can never be wrong.
a)
True
b)
False
39.
If plants are exposed to sunlight, then they will grow taller.
What part of the scientific method is this an example of?
a)
Procedure
b)
Hypothesis
c)
Question
d)
Results
40.
Which of the following IS considered safety equipment in our classroom?
a)
Eyewash Station
b)
Emergency Shower
c)
Fire Extinguisher
d)
All of the Above.
41.
You should report accidents to the teacher __.
a)
after the class is over
b)
immediately 
c)
the following day
d)
never
42.
Independent variable is located on which axis?
a)
x-axis
b)
y-axis
43.
A class survey revealed that out of 30 students, 13 listed their favorite lunch item as pizza, 9 chose cheeseburgers, 6 picked lasagna, and 2 chose tacos. What type of graph would be the most accurate type to display these results
a)
pie
b)
bar
c)
line
d)
histogram
44.

What type of graph best shows change of dependent variable over time?

a)

Circle chart

b)

Line graph

c)

Bar graph

d)

Data table

45.
what does the relationship of the results on this graph show 
a)
as force increases, extension increases.
b)
As force increases, extension decreases.