wayground logo

Free Printable Worksheets

Font size

S
M
L
XL
Worksheets

Graphs of motion

Total questions: 34

Worksheet time: 37mins

Name
Class
Date
1.
During which interval is the object not moving?
a)
B to C
b)
C to D
c)
D to E
d)
only at point A
2.
During which interval is the object traveling at a constant velocity?
a)
B to C
b)
D to E
c)
F to G
d)
it traveling at a constant velocity during all of the intervals shown.
3.
During which interval is the object speeding up?
a)
A to B
b)
B to C
c)
D to E
d)
E to F
4.
During which interval is the object slowing down?
a)
A to B
b)
D to E
c)
E to F
d)
G to H
5.
Which runner stopped for a rest?
a)
Albert
b)
Bob
c)
Charlie
6.
Which runner won the race?
a)
Albert
b)
Bob
c)
Charlie
7.
How long did one of the runner's rest?
a)
8 seconds
b)
13 seconds
c)
5 seconds
d)
50 seconds
8.
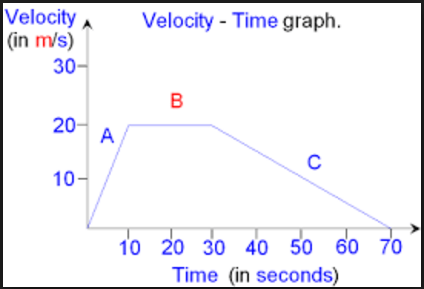
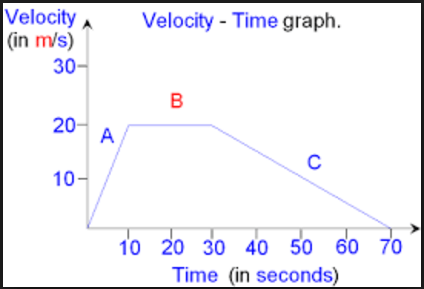
This is a velocity-time graph.  What is the object doing in segment A?
a)
Positive acceleration
b)
Negative acceleration
c)
Constant Velocity
d)
Not moving
9.
This is a velocity-time graph.  What is the object doing in segment B?
a)
Positive acceleration
b)
Negative acceleration
c)
Constant Velocity
d)
Not moving
10.
This is a velocity-time graph.  What is the object doing in segment C?
a)
Positive acceleration
b)
Negative acceleration
c)
Constant Velocity
d)
Not moving
11.

Calculate the acceleration for segment A.

a)

2 m/s2

b)

20 m/s2

c)

-2 m/s2

d)

0 m/s2

12.
A car driving at 50 miles per hour drives for 2 hours. What distance did it cover?
a)
50 miles
b)
25 miles
c)
100 miles
d)
75 miles
13.
Velocity is
a)
speed and acceleration
b)
constant speed
c)
a frame of reference
d)
speed in a given direction
14.
Acceleration is
a)
increasing speed
b)
decreasing speed
c)
changing direction
d)
all of the above
15.

In the this equation what does the s represent? 


v = s / t 


(a)  

16.

What is the formula for speed?

a)

speed = distance x time

b)

speed=distance / time

c)

speed = time / distance

d)

speed = distance + time

17.

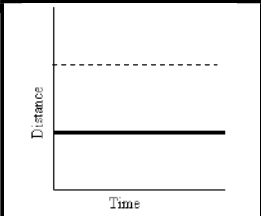
What does the solid line on this graph represent?

a)

Constant speed

b)

Acceleration

c)

At rest

d)

deceleration

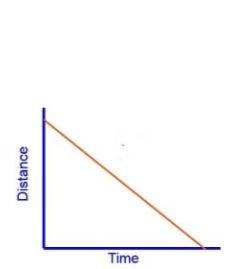
18.

What is the line on this graph showing?

a)

moving away from starting point at a constant speed

b)

moving back towards the starting point at a constant speed

c)

acceleration (getting faster)

d)

deceleration (getting slower)

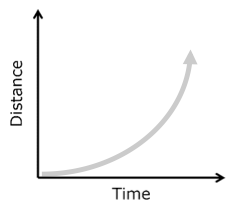
19.

What is this line of this graph showing?

a)

moving away from starting point at a constant speed

b)

moving back towards the starting point at a constant speed

c)

acceleration (getting faster)

d)

deceleration (getting slower)

20.
Which graph is showing acceleration (getting faster)
a)
D
b)
E
c)
both D and E
d)
neither D or E
21.
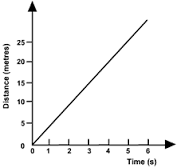
How long did it take this object to travel 10 m?
a)
0 s
b)
10 s
c)
15 s
d)
20 s
22.
At 60 seconds, how far had this object traveled? 
a)
0 m
b)
10 m
c)
20 m
d)
40 m
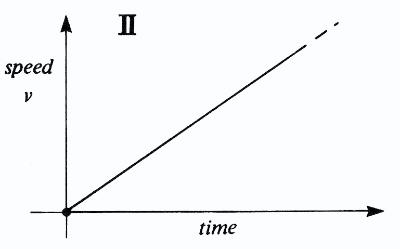
23.

What is represented by this graph?

a)

constant speed

b)

not moving

c)

speed increasing

d)

speed increasing at a constant rate

24.

what is the motion described in the graph

a)

all of above

b)

constant speed

c)

acceleration

d)

constant position

25.
Velocity is
a)
speed and acceleration
b)
constant speed
c)
a frame of reference
d)
speed in a given direction
26.

What is happening at E?

a)

Stationary

b)

Accelerating

c)

Constant speed; moving away from the starting position

d)

Constant speed; returning to start position

27.
What happened during C to D point?
a)
not moving
b)
increasing speed at a constant rate
c)
moving at a constant speed
d)
moving at 0 m/sacceleration
28.

What happened during E to F point?

a)

not moving

b)

increasing speed at a constant rate

c)

constant speed

d)

acceleration

29.

What happened during B to C point?

a)

deceleration

b)

constant speed

c)

at rest

d)

acceleration

30.
This graph demonstrates an object that is -
a)
Increasing speed
b)
At a constant speed
c)
Decreasing speed
d)
Stationary
31.
This graph demonstrates an object that is -
a)
Increasing speed
b)
At a constant speed
c)
Decreasing speed
d)
Stationary
32.
Which line represents an object moving at a faster speed?
a)
A
b)
B
33.
Which line represents an object moving at a slower speed?
a)
A
b)
B
34.
Acceleration occurs when an object changes its speed or ______.
a)
direction
b)
force
c)
inertia
d)
mass