
 Worksheets
Motion Graph Review
Total questions: 55
Worksheet time: 13hrs 3mins
What two measurements are necessary for calculating speed?
Mass and time
Temperature and mass
Mass and distance
Distance and time
A measurement of how fast an object is moving in a specific direction is...
Velocity
Speed
Vector
Acceleration


What does this graph represent?
Constant speed
Speeding up
Slowing down
Not moving



What is happening at E?
Stationary
Accelerating
Slower steady speed; moving away from the starting position
Steady speed; returning to start position


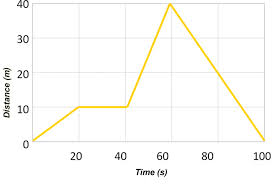
How long did it take this object to travel back to its reference/starting point from 40 m?
20 s
40 s
60 s
100 s

What is the object's average speed in the first 10 meters?
10 m/s
20 m/s
2 m/s
0.5 m/s
What is the object's average speed in the from 40 to 60 seconds?
0.67 m/s
40 m/s
1.5 m/s
0.5 m/s
What is the object's average speed from 60 to 100 seconds?
10 m/s
2.5 m/s
1 m/s
40 m/s
What is the object's average speed in the from 20 to 40 seconds?
2 m/s
0.25 m/s
0 m/s
0.5 m/s
After 100 seconds, how far had this object traveled in all?
0 m
40 m
80 m
100 m

What is the speed of segment A?
0.5 m/s
2 m/s
3 m/s
0 m/s
What is the speed of segment B?
0.5 m/s
2 m/s
3 m/s
0 m/s
What is the speed of segment C?
0.5 m/s
2 m/s
3 m/s
0 m/s
What is the speed of segment D?
0.5 m/s
2 m/s
3 m/s
0 m/s

What is the total distance traveled?
20 m
30 m
40 m
50 m
What is the total time traveled?
20 s
30 s
40 s
50 s

What is the average speed for the entire trip?
1.33 m/s
4 m/s
5 m/s
7 m/s

What is the motion of segment A?
Moving towards the reference point constant speed
Moving away from the reference point constant speed
Moving towards the reference point changing speed
Not moving
What is the motion of segment C?
Moving towards the reference point at a constant speed
Moving away from the reference point constant speed
Moving towards the reference point changing speed
Not moving
What is the motion of segment D?
Moving towards the reference point constant speed
Moving away from the reference point changing speed
Moving towards the reference point changing speed
Not moving

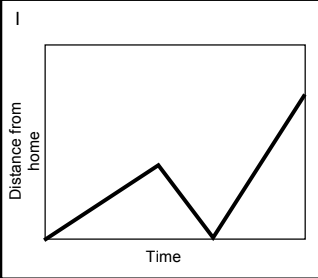
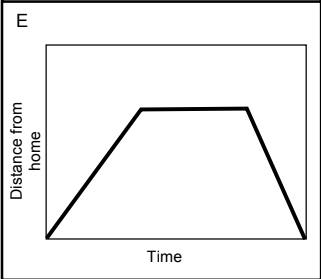
Which situation might this graph describe?
Driving to Raleigh, hitting traffic, stopping for a concert, and coming back home.
Running a mile up hill, taking a break, running back home
Running part way across a football field, slowing down to avoid a hole, pausing to pick up a football, running back to the start
Biking to a friends house, turning around because you forgot something, rushing to the friends's house to stay the night, biking back home.





What is the object's average speed from point A to point B?
3 m/s
0.3 m/s
15 m/s
5 m/s
What is the object's average speed from point B to point C?
11.3 m/s
2.5 m/s
4.4 m/s
6.67 m/s
What is the object's average speed from point C to point D?
0 m/s
2.5 m/s
6.67 m/s
11.7 m/s
What is the object's average speed from point D to point E?
0.3 m/s
1.9 m/s
3.3 m/s
0.7 m/s
What is the object's average speed during the entire trip?
0.3 m/s
1.9 m/s
3.2 m/s
4.1 m/s
How can you tell an object is in motion?
because it moves
it changes position
by comparing it to a non-moving reference point
both b and c
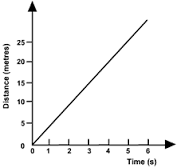
What is the line on this graph showing?
moving away from starting point at a constant speed
moving back towards the starting point at a constant speed
acceleration (getting faster)
deceleration (getting slower)


A golfer collected data on the distance a golf cart traveled in a straight line and plotted it on a graph. Which of these does NOT describe the cart’s motion on this graph?
The cart moved 24 m away from the starting point between 2 s and 5 s.
The cart moved toward the starting point at a speed of 3 m/s between 7 s and 12 s.
The cart moved 11 m toward the starting point between 8 s and 10 s.
The cart moved away from the starting point at a speed of 1 m/s for 2 s.

The graph below shows the motion of a ball rolling on a straight track. What was the ball’s average speed during the time represented in the graph?
0.2 m/s
0.5 m/s
5.0 m/s
10.0 m/s

A hobbyist collected data about the motion of a toy train on a straight track and then recorded the data in the graph below. Which of these accurately describes the motion of the toy train?
The toy train speeds up while going forward and then slows down.
The toy train slows down while going forward and then moves backward.
The toy train moves forward at a constant speed, slows down, and then stops.
The toy train moves forward at an increasing speed, stops, and then moves forward.
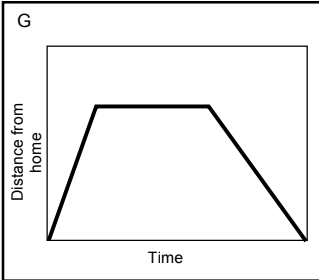
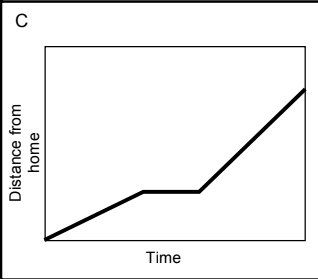
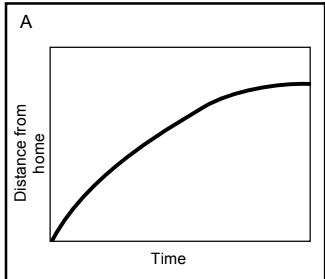
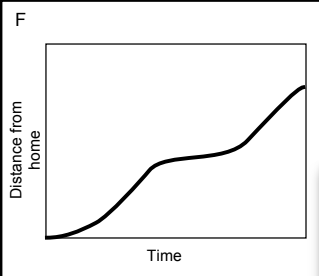
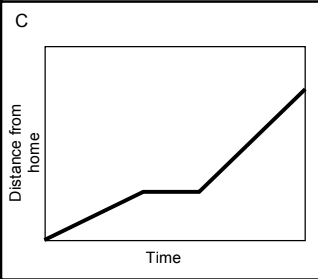
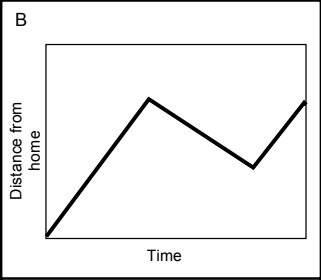
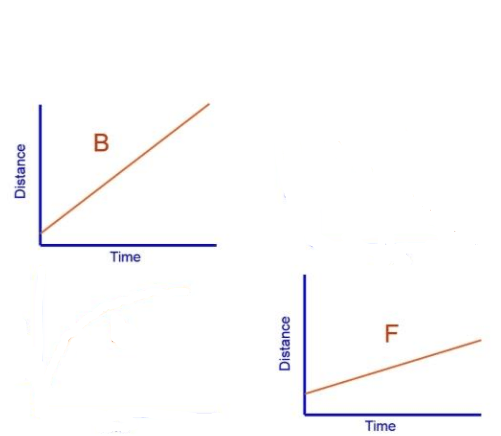
A student runs two times around a running path at a local park. Each lap is 3 km. The student completes the first lap in 20 minutes. The student then sits on a bench and rests for 5 minutes before completing the second lap in 25 minutes. Which graph best represents the student’s motion?


The graph below shows distance over time. Which of these situations could be represented by this graph?
A student walks 1.5 km to a friend’s house in 40 minutes. The two students then walk another 1.5 km to school in 20 minutes.
A student walks 1.5 km to a friend’s house in 20 minutes. The two students then walk another 1.5 km to school in 40 minutes.
A student walks 1.5 km to a friend’s house in 30 minutes. The two students then walk another 1.5 km to school in 30 minutes.
A student walks 1.5 km to a friend’s house in 20 minutes. The two students then walk another 1.5 km to school in 60 minutes.


