wayground logo

Free Printable Worksheets

NEW

Font size

S
M
L
XL
Worksheets

Probability and Stats EXAM C 2023

Total questions: 75

Worksheet time: 2hrs 54mins

Name
Class
Date
1.

Find the median of the data set.


4, 7, 3, 5, 6

a)

3

b)

4

c)

5

d)

6

2.

Find the mode of the data set.


14, 20, 16, 14, 18, 20, 19, 13, 15, 17

a)

No mode

b)

14

c)

20

d)

both 14 and 20

3.

Find the mean of the data set.


8, 12, 16, 10, 8, 6

a)

60

b)

10

c)

6

d)

14

4.

Find the outlier of the data set.


15, 20, 18, 35, 17, 35, 13

a)

no outlier

b)

35

c)

13

d)

15

5.

The middle number of an ordered set of data is called what?

a)

mean

b)

median

c)

mode

d)

outlier

6.

Find the range in the data set.


14, 20, 19, 22, 14, 17

a)

14

b)

8

c)

6

d)

no range

7.

The ___ is the data item(s) that occur the most often.

a)

mean

b)

median

c)

mode

d)

range

8.

Find the mean of the data set.


31, 20, 51, 31, 27

a)

31

b)

51

c)

27

d)

30

9.

Find the median of the data.


20, 30, 45, 90, 60, 45, 5, 10, 30, 45, 15, 25

a)

35

b)

30

c)

no median

d)

45

10.

A(n) ____ of a data set is much greater or much less than the other data values.

a)

mean

b)

median

c)

mode

d)

outlier

11.

How many students like hockey?

a)

2

b)

4

c)

3

12.

Which sport has the highest number?

a)

Basketball

b)

Hockey

c)

Soccer

13.
How many people have two or less books in their desk?
a)
4
b)
5
c)
6
d)
7
14.
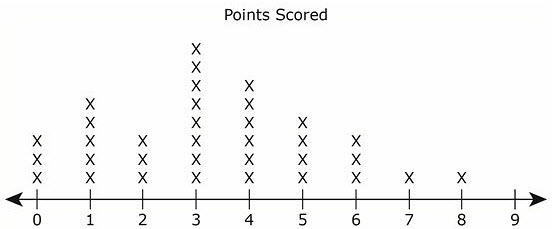
The dot plot below shows the points scored by players in a basketball game.

What is the difference between the number of players who scored fewer than 4 points and the number of players who scored more than 4 points?
a)
4 players
b)
10 players
c)
13 players
d)
15 players
15.
What percentage does a whole circle graph represent?
a)
360%
b)
90%
c)
50%
d)
100%
16.
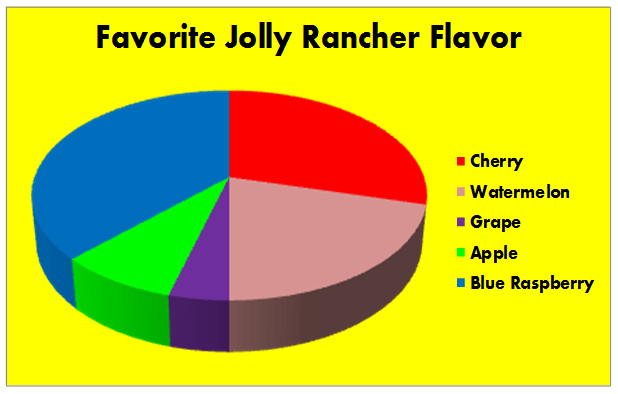
According to this graph, what is the most popular flavor of Jolly Rancher?
a)
Cherry
b)
Grape 
c)
Blue Rasberry
d)
Watermelon
17.
All 25 students in our class were surveyed about what their favorite food is.  11 students chose pizza. What percentage of the class chose pizza?
a)
20%
b)
44%
c)
15%
d)
60%
18.
If there are 300 seventh graders, how many students prefer choir?
a)
96
b)
24
c)
75
d)
42
19.
What is the name of this graph?
a)
line plot
b)
line graph
c)
bar graph
d)
frequency table
20.
What is the main purpose of a line graph?
a)
to compare two things
b)
to show trends over time
c)
to have an independent variable
d)
so you don't have to read words
21.
What label is along the y-axis in this graph?
a)
Copyright 2007
b)
Lines
c)
Age in Years
d)
Number of Teens
22.
When was the greatest amount of shoppers at the store?
a)
10am
b)
1pm
c)
6pm
d)
2pm
23.
When was my weight the lowest?
a)
July
b)
September
c)
November
d)
December
24.
How many cars were sold on Saturday and Sunday?
a)
5
b)
3
c)
8
d)
10
25.
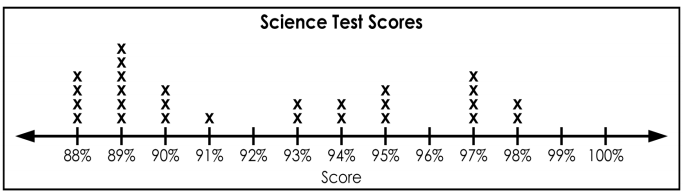
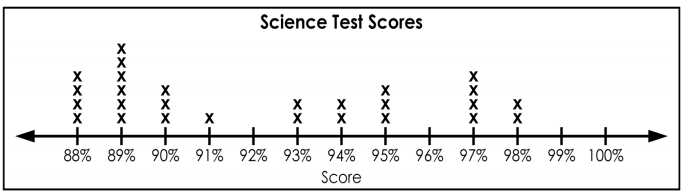
What is the highest score in the class?
a)
88%
b)
100%
c)
13
d)
98%
26.
How many students received a score of 94%? 
a)
94
b)
4
c)
1
d)
2
27.
How many students scored 93% or less?
a)
6
b)
16
c)
14
d)
13
28.

How many children have three televisions in their home?

a)

6

b)

7

c)

10

d)

1

29.
Convert 3/4 to a decimal.
a)
.34
b)
.60
c)
.43
d)
.75
30.
What is 4/7 as a decimal?
a)
4.7
b)
.57
c)
7.4
d)
5.7
31.
Convert 4/5 to a decimal
a)
.45
b)
.80
c)
.40
d)
.54
32.
Rewrite 6/11 as a decimal 
a)
0.05454...
b)
5.45454...
c)
0.545454...
d)
1.83333...
33.
Write 4/100 as a decimal
a)
0.4
b)
0.04
c)
4.4
d)
4
34.
Convert 4/5 to a percent.
a)
45%
b)
4.5%
c)
80%
d)
8%
35.
There is one pizza and two people are going to split it in half. How would you convert one half into a fraction, decimal and percent?
a)
1/2  ,  0.5  ,  50%
b)
1/4  ,  0.25  ,  25%
c)
3/4  , 0.75  ,  75%
d)
\1/20  ,  0.05 ,  5%
36.
Three out of ten people chose art as their favorite elective. How would 3/10 be converted into a decimal?
a)
3/10 = .310
b)
3/10 = 30.
c)
3/10 = .3
d)
3/10 = 3.00
37.
What is 20% written in decimal form?
a)
2.0
b)
.2
c)
20.
d)
.02
38.
Express 0.87 as a percent.
a)
0.87%
b)
8.7%
c)
87%
d)
870%
39.
How many people were surveyed?
a)
20
b)
10
c)
18
d)
8
40.
On which day was the least amount of money made?
a)
Friday
b)
Monday
c)
Saturday
d)
Sunday
41.

Based on the data in the table, how many students played the three games that had the highest frequency?

a)

62

b)

57

c)

60

d)

61

42.
What is the range of the scores?
a)
20
b)
25
c)
30
d)
35
43.
What is the mode of the scores?
a)
24
b)
14
c)
34
d)
30
44.
How many scores are listed in this Stem and Leaf Plot?
a)
3
b)
6
c)
9
d)
18
45.

What is the lowest score someone got on the quiz?

a)

0

b)

4

c)

9

d)

40

46.

What was the highest quiz grade on the quiz?

a)

9

b)

26

c)

92

d)

96

47.
How many students scored more than 80%?
a)
10
b)
13
c)
7
d)
15
48.
Students at Cooper Elementary school took a survey about what kinds of pets they had at home. Then, students plotted that information on a frequency table. 
How many kids have dogs and cats for pets?
a)
19
b)
12
c)
7
d)
20
49.
_______ is the entire group of objects or individuals considered for a survey.
a)
Sample
b)
Population
c)
Random Sample
d)
Quartile
50.
_______ is a part of a group being surveyed.
a)
Sample
b)
Population
c)
Random Sample
d)
Quartile
51.
A school surveys all 7th grade boys to determine what to sell in the school store.  This sample is _________.
a)
Biased
b)
Unbiased
c)
Representative
d)
Peanut butter cups
52.

What do you have to have to make a graph

a)

data

b)

facts

c)

paper

d)

Infor

53.

What do we put at the top of a graph?

a)

X axis

b)

data table

c)

title

d)

nothing

54.
What is the name of the horizontal (side to side) axis of the graph? 
a)
X axis
b)
Y axis
55.
A graph is...
a)
An analysis of an observation.
b)
A visual representation of data.
c)
short for graphite.
d)
used to conduct an experiment.
56.

Find the Quartile 1 of the following data set:

2, 3, 4, 5, 5, 5, 7,

a)

4

b)

6

c)

3

d)

5

57.

Find the Quartile 3 of these numbers:

2, 3, 4, 5, 5, 5, 7,

a)

4

b)

6

c)

3

d)

5

58.
33, 25, 42, 25, 31, 37, 46, 29, 38
What is the third quartile (UQ) of the data?
a)
37
b)
38
c)
40
d)
46
59.
Quartiles are values that divide a data set into four equal parts.
a)
True
b)
False
60.

How many people have only 1 pet?

a)

4

b)

6

c)

5

d)

3

61.

Rank the data in order from least to greatest.

a)

0, 0, 1, 1, 1, 1, 1, 1, 1, 2, 2, 2, 3, 4, 4

b)

0, 0, 0, 1, 1, 1, 1, 1, 1, 2, 2, 2, 3, 4, 4

c)

0, 0, 1, 1, 1, 1, 1, 1, 1, 2, 2, 3, 3, 4, 4

d)

0, 0, 1, 1, 1, 1, 1, 1, 1, ,1 2, 2, 3, 4, 4

62.
How many students had more than 6 candy bars?
a)
5
b)
2
c)
3
d)
1
63.
How many students received a score in the 80's?
a)
2
b)
10
c)
14
d)
27
64.

Find the mean?

a)

3.3

b)

99

c)

97.4

d)

98

65.

What is the Mode?

a)

97.4

b)

97.2

c)

97

d)

96.8

66.
What is the range of the data shown in the stem and leaf plot?
a)
40
b)
56
c)
136
d)
96
67.

How many scores are listed in this Stem and Leaf Plot?

a)

3

b)

6

c)

9

d)

18

68.

We need water to live

a)

Certain

b)

Likely

c)

Unlikely

d)

Impossible

69.

How likely are you to grab a square?

a)

Likely

b)

Unlikely

c)

Equally Likely

70.

Given the picture shown, what is the probability of choosing a blue gumball?

a)

Likely

b)

Unlikely

c)

Equally likely

71.

Given the picture shown, what is the probability of choosing a blue gumball?

a)

Likely

b)

Unlikely

c)

Equally likely

72.

Not a good chance of event happening

a)

likely

b)

certain

c)

unlikely

d)

impossible

73.

Even chance of event happening as not happening

a)

unlikely

b)

equally likely

c)

certain

d)

impossible

74.

Good chance of event happening

a)

impossible

b)

likely

c)

certain

d)

maybe

75.

Event will happen

a)

likely

b)

certain

c)

impossible

d)

unlikely