
 Worksheets
Graphing Motion
Total questions: 30
Worksheet time: 35mins


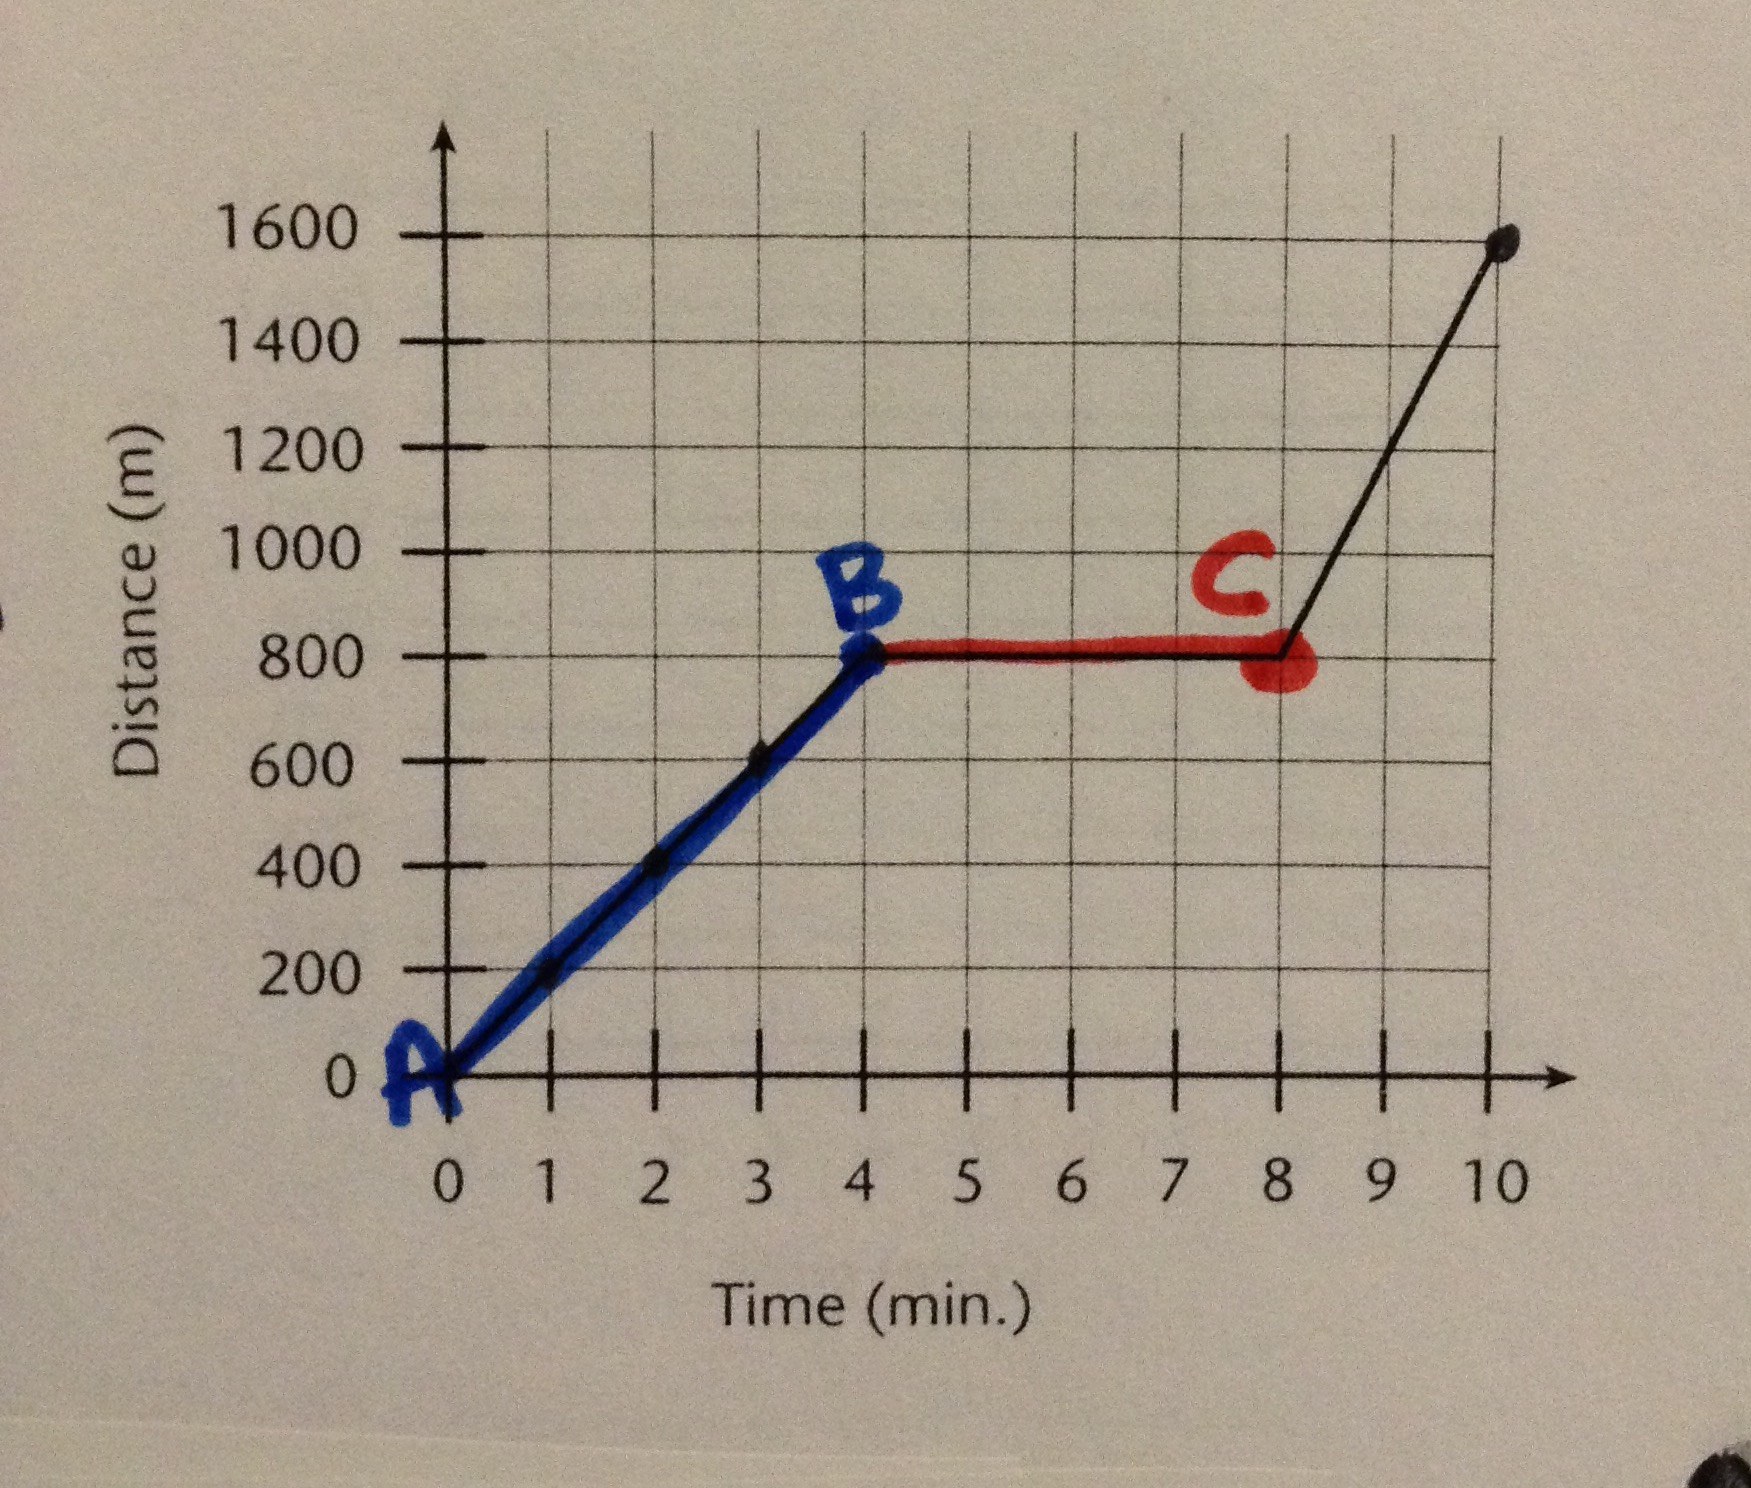
What is occurring from point A to point B?
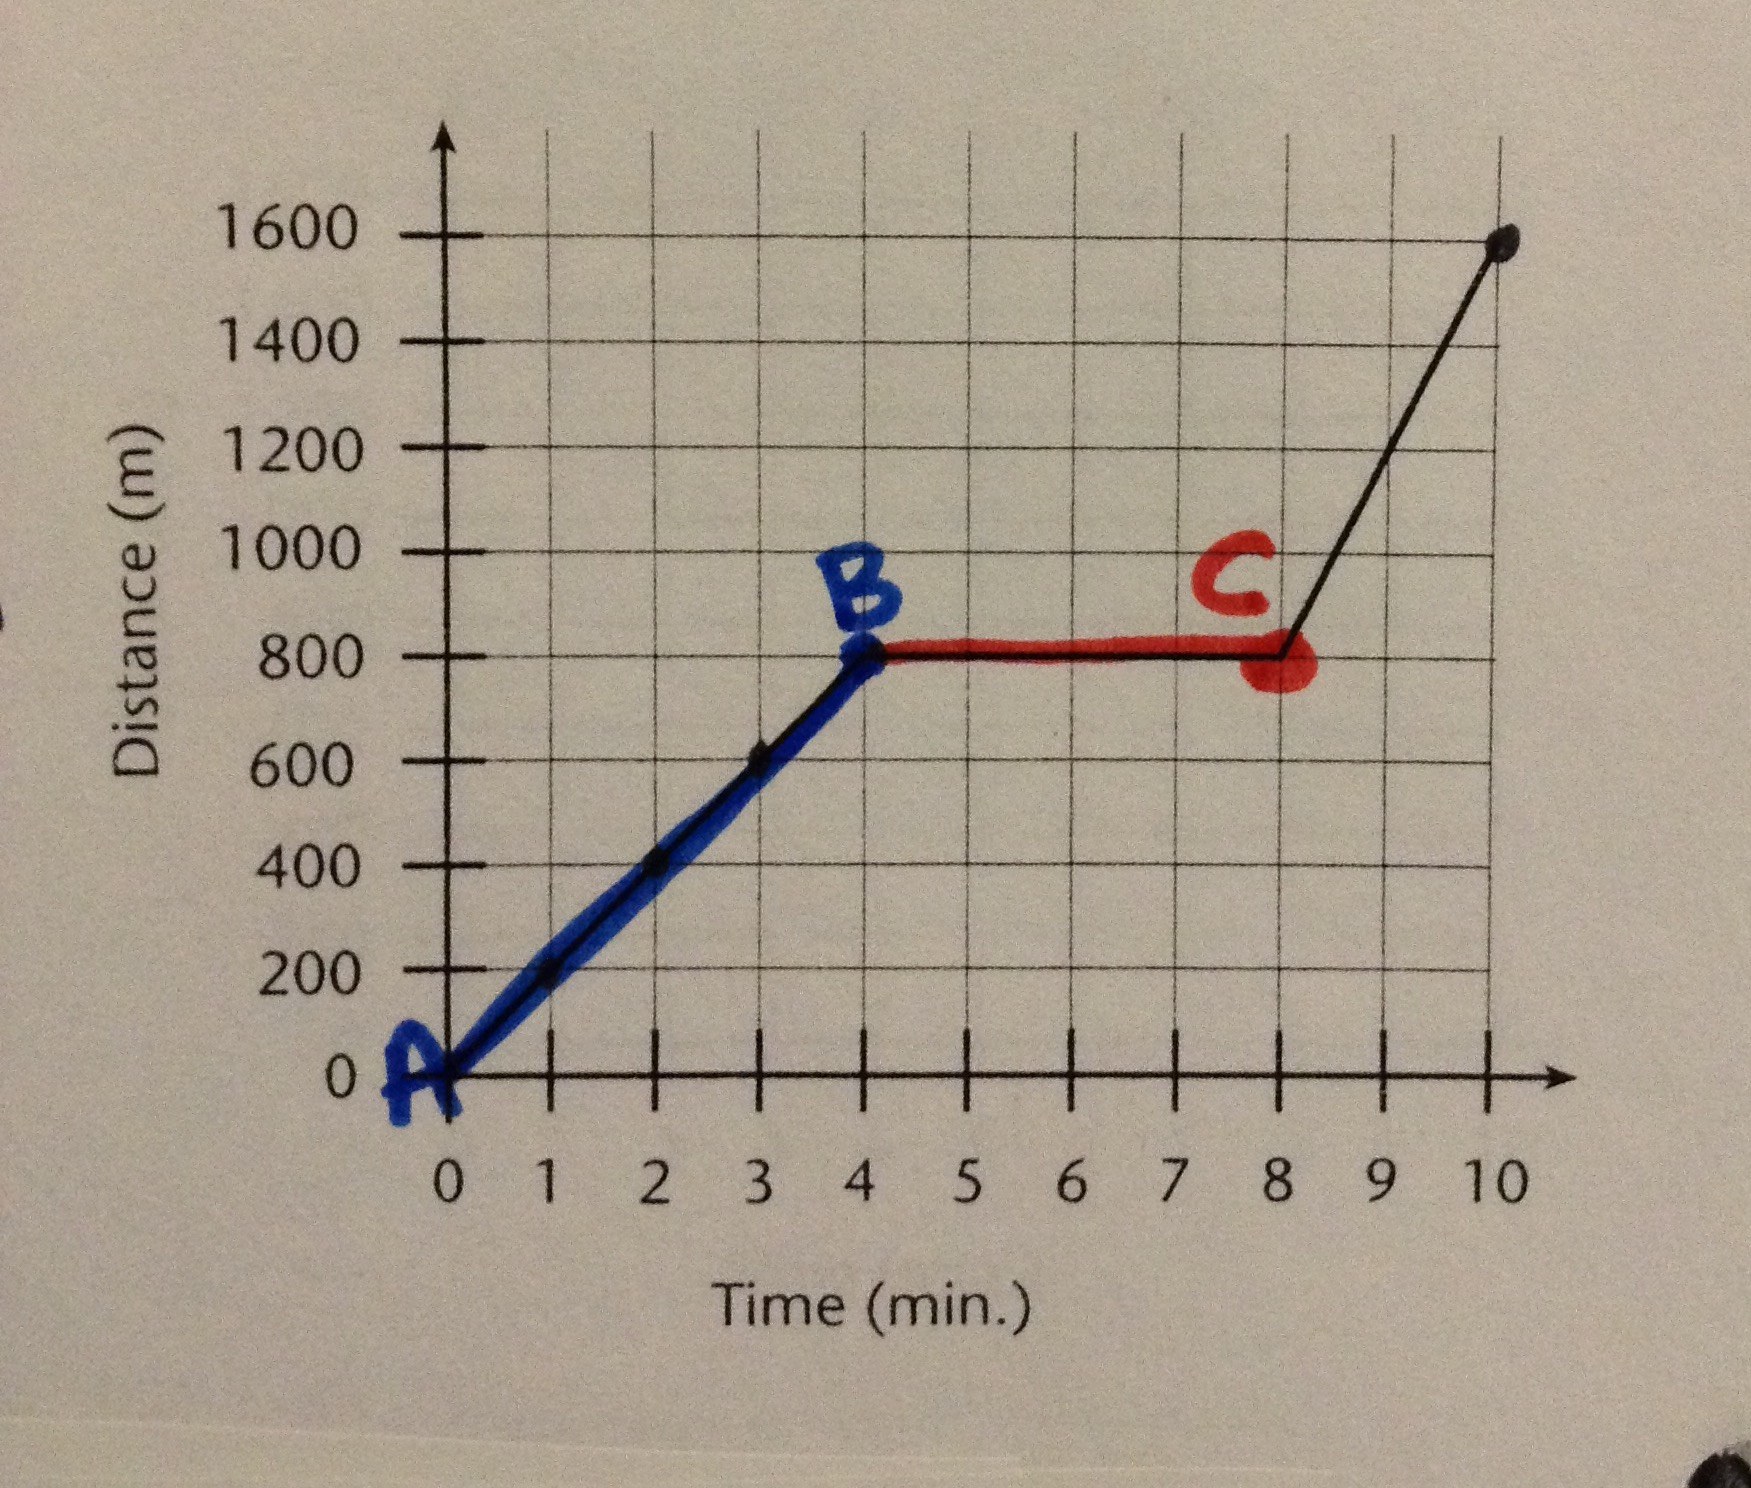
What was occurring from point B to point C?

Describe the motion
Slow to fast; change in direction
Fast to slow; change in direction
Fast to slow; no change in direction
Slow to fast; no change in direction

This is a velocity-time graph. What is the object doing in segment C?
Constant acceleration
Constant deceleration
Constant Velocity
Not moving


Which runner complete the 100 meter race in the most amount of time?
Albert
Bob
Charlie


What was Charlie doing between 8 seconds and 13 seconds?
He was stopped
He was accelerating
He was returning to start
He was traveling at a constant velocity


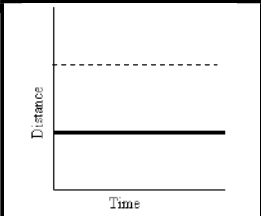
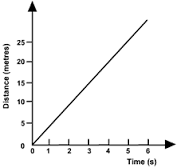

What does the red line mean in this graph?
Increasing acceleration
Constant velocity
Constant acceleration
What does the green line mean in this graph?
Increasing acceleration
Constant velocity
Constant acceleration
What does the blue line mean in this graph?
Increasing acceleration
Constant velocity
Constant acceleration

Which line shows a fast constant speed?
red
yellow
green
purple
Which lines shows a constant speed?
red
yellow
green
purple
Which line shows acceleration?
red
yellow
green
purple
Which line shows velocity?
red
yellow
green
purple
Which line shows no motion?
red
yellow
green
purple

What is the object's average speed?
10 km/min
40 km/min
4 km
40 minutes

What is the object's speed from 10-20 minutes?
1.5 km/min
0 km/min
0.15 km/min
1 km/min

What is the object's speed 30 minutes?
4 km
0.13 km/min
7.5 km/min
0 km/min

What is the Y-axis title of this graph?
Distance (km)
Time Taken (minutes)

