wayground logo

Free Printable Worksheets

Font size

S
M
L
XL
Worksheets

8th grade MAD and scatterplots test review

Total questions: 130

Worksheet time: 9hrs 31mins

Name
Class
Date
1.
What is Mean Absolute Deviation?
a)
The mean of the data
b)
The absolute value of the mean
c)
The variation of data values around the mode
d)
The rage distance between the data values and the mean
2.
What is the first step when calculating the Mean Absolute Deviation?
a)
Find the distance each value is from the mean
b)
Find the mean of the distances
c)
Find the mean of the data
3.
What is the second step when calculating the Mean Absolute Deviation?
a)
Find the distance each value is from the mean
b)
Find the mean of the distances
c)
Find the mean of the data
4.
What is the third step when calculating the Mean Absolute Deviation?
a)
Find the distance each value is from the mean
b)
Find the mean of the distances
c)
Find the mean of the data
5.
Find the Mean Absolute Deviation:  5, 11, 2, 7, 16.  The Mean is 8.2 
a)
3.2
b)
2.8
c)
1.2
d)
4.2
6.
Find the Mean Absolute Deviation:  10, 9, 3, 8, 10.  The Mean is 8
a)
3
b)
5
c)
1
d)
2
7.
What is another word for average?
a)
Mean
b)
Median
c)
Mode
d)
Range
8.
Which mean absolute deviation would have a greater variability or spread?  4.2 or 8.5?
a)
4.2
b)
8.5
9.
Which mean absolute deviation would be more consistent? 4.2 or 8.5?
a)
4.2
b)
8.5
10.
True or false? :The larger the Mean Absolute Deviation the more consistent the data is.
a)
True
b)
False
11.
In calculating MAD, after you find the absolute deviations you must _____________.
a)
Do nothing because you are done.
b)
Subtract them from the mean.
c)
Find the mean of the absolute deviations.
12.
Which dot plot shows more consistency? a or b?
a)
a
b)
b
13.
Which dot plot shows more variability? a or b?
a)
a
b)
b
14.
True or false?:The absolute value of a number will always be positive.
a)
True
b)
False
15.
True or false?: You subtract the mean from each data value to find the absolute deviation.
a)
True
b)
False
16.
In calculating MAD, after you find the average or mean you must _____________. 
a)
do nothing because you're done
b)
Find out the distance each number is from the mean.
c)
Find the distance each number is from zero.
17.
Find the MAD:
58, 38, 54, 48, 26, 36
a)
43
b)
20
c)
10
d)
12
18.
Which of the following is the mean absolute deviation for the set of data?
2.50 3.75 1.25 2.25 3.00
a)
3.3
b)
0.66
c)
2.50
d)
2.55
19.
Find the MAD for the following set: 85, 90, 68, 75, 79
a)
79.4
b)
6.48
c)
32.4
d)
79
20.
Find the Mean Absolute Deviation:  10, 9, 3, 8, 10.  The Mean is 8
a)
3
b)
5
c)
1
d)
2
21.
Find the mean absolute deviation for the set of data.  Round to the nearest hundredth if necessary.  
Number of daily visitors to a web site:  112, 145, 108, 160, 122.
a)
92.40
b)
42.41
c)
129.4
d)
18.48
22.
Find the MAD:
58, 38, 54, 48, 26, 36
a)
43
b)
20
c)
10
d)
12
23.
Determine the mean absolute deviation of the data. 9, 7, 11, 10, and 8
a)
9
b)
6
c)
1.2
d)
5
24.
Calculate the M.A.D 13, 17, 19, 27
a)
4
b)
19
c)
6
d)
8
25.
Find the MAD for the following set: 65, 90, 85, 70, 70, 95, 55
a)
12.24
b)
75.7
c)
85.7
d)
40
26.
Calculate the M.A.D. of the data 38, 66, 88, 90
a)
70.5
b)
20.5
c)
18.5
d)
25
27.
Calculate the Mean Absolute Deviation 156, 189, 134, 220, 138, 192
a)
171.5
b)
28.8
c)
35
d)
25
28.
Calculate the Mean Absolute Deviation 7, 9, 2, 7, 3, 5, 10
a)
2.41
b)
2
c)
4.21
d)
3
29.
Determine the mean absolute deviation of the data. 9, 7, 11, 10, and 8
a)
9
b)
6
c)
1.2
d)
5
30.

Determine the mean absolute deviation (MAD), 10, 8, 5, 12, 20

a)

3.4

b)

4

c)

11

d)

5

31.
Find the MAD:
58, 38, 54, 48, 26, 36
a)
43
b)
20
c)
10
d)
12
32.
What is the mean of this data set?
6, 7, 2, 1, 5, 2, 1, 6
a)
24.75
b)
3
c)
3.7
d)
3.8
33.
Find the MAD for the following set: 85, 90, 68, 75, 79
a)
79.4
b)
6.48
c)
32.4
d)
79
34.
An amusement park recorded the ages of the first ten people to ride a new attraction. The ages were as follows: 11, 34, 16, 18, 22, 30, 18, 20, 15, and 16. What is the mean absolute deviation of this data set? 
a)
20
b)
5.2
c)
18
d)
4.8
35.
Which M.A.D. would show the most consistency?
a)
.5
b)
1
c)
1.5
d)
2
36.
What is the mean of this data set?
6, 7, 2, 1, 5, 2, 1, 6
a)
24.75
b)
3
c)
3.7
d)
3.8
37.
The following scatter plot shows Pam's training as she prepares to run a 6 mile race at the end of the month.  Which of the following would be a reasonable approximation for the length of time it would take for her to run 6 miles? 
a)
A. 50 min
b)
B. 80 min
c)
C. 45 min
d)
D. 60 min
38.
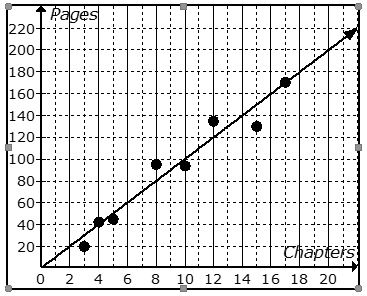
The scatter plot shows the relationship between the number of chapters and the total number of pages for several books.  Use the trend line to predict how many chapters would be in a book with 180 pages. 
a)
12 chapters
b)
15 chapters
c)
18 chapters
d)
21 chapters
39.
1.  Mrs. Collins made a scatterplot to show the relationship between the number of absences and a student’s final exam score. Based on this scatterplot, a student with 6 absences should get approximately what score on the final exam? 
a)
65
b)
92
c)
70
d)
76
40.
What type of correlation (association)?
The outside temperature and the amount of layers you wear. 
a)
Positive correlation
b)
Negative correlation
c)
No correlation
41.
Mrs. Collins made a scatterplot to show the relationship between the number of absences and a student’s final exam score. Based on this scatterplot, a student with 6 absences should get approximately what score on the final exam? 
a)
85
b)
92
c)
70
d)
76
42.
The number of siblings you have and your weight. 
a)
Positive correlation
b)
Negative correlation
c)
No correlation
43.
If Gold's Gym paid $250 for each TV, how many did they buy?
a)
35
b)
30
c)
45
d)
20
44.
If the carpenter worked for 6 days, how much did he earn?
a)
1250
b)
1500
c)
1750
d)
2000
45.
What is the correlation between length of running start and distance of jump?
a)
positive:  the further you run the further you jump
b)
negative: the less you run the less distance of your jump
c)
positive: the further your running start the less your distance
46.
Make a prediction for a resting heart rate after 6 hours of exercise a week.
a)
6
b)
50
c)
55
d)
59
47.
The scatter plot below shows the number of books read by students in Mrs. Hall’s English class and their final grades. Which statement represents the best description about the line of best fit?
a)
The more books students read, the lower their English grade.
b)
The more books students read, the higher their English grade.
c)
The fewer books students read, the higher their English grade. 
d)
No relationship exists between the number of books students read and their English grades. 
48.
According to the graph, how many students are in the class?
a)
26
b)
25
c)
15
d)
30
49.
If Zion works 45 hours a week, how much will his weekly salary be?
a)
about $500
b)
$600
c)
about $700
d)
$1500
50.
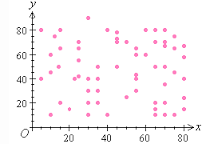
What type of correlation does this graph have?
a)
positive 
b)
negative
c)
none
d)
all of the above
51.
What type of correlation does this graph have?
a)
Negative 
b)
no association
c)
positive 
52.
What type of correlation does this graph have?
a)
positive
b)
negative
c)
none
d)
all of the above
53.
The scatter plot shows the relationship between the number of chapters and the total number of pages for several books.  Use the trend line to predict how many chapters would be in a book with 180 pages. 
a)
12 chapters
b)
15 chapters
c)
18 chapters
d)
21 chapters
54.
Mrs. Collins made a scatterplot to show the relationship between the number of absences and a student’s final exam score. Based on this scatterplot, a student with 6 absences should get approximately what score on the final exam? 
a)
65
b)
92
c)
70
d)
76
55.
What type of correlation (association)?
The outside temperature and the amount of layers you wear. 
a)
Positive correlation
b)
Negative correlation
c)
No correlation
56.
The scatter plot below shows the number of books read by students in Mrs. Hall’s English class and their final grades. Which statement represents the best description about the line of best fit?
a)
The more books students read, the lower their English grade.
b)
The more books students read, the higher their English grade.
c)
The fewer books students read, the higher their English grade. 
d)
No relationship exists between the number of books students read and their English grades. 
57.
The scatter plot shows the relationship between the number of chapters and the total number of pages for several books.  Use the trend line to predict how many chapters would be in a book with 180 pages. 
a)
12 chapters
b)
15 chapters
c)
18 chapters
d)
21 chapters
58.
What type of association does this graph show?
a)
Positive
b)
negative
c)
none
d)
all of the above
59.
What type of correlation (association)?
The outside temperature and the amount of layers you wear. 
a)
Positive correlation
b)
Negative correlation
c)
No correlation
60.
If Gold's Gym paid $250 for each TV, how many did they buy?
a)
35
b)
30
c)
45
d)
20
61.
If Gold's Gym is looking to buy 30 TVs, how much will each one cost?
a)
400
b)
750
c)
1250
d)
0
62.
If the debate team practiced for only 1 hour, how many debates are they expected to win?
a)
2
b)
6
c)
10
d)
14
63.
If Zion works 45 hours a week, how much will his weekly salary be?
a)
about $500
b)
$600
c)
about $700
d)
$1500
64.
What type of relationship does this scatter plot show?
a)
Positive
b)
Negative
c)
No Relationship
d)
Constant
65.
Which scatter plot show a positive relationship?
a)
Graph A
b)
Graph B
c)
Graph C
d)
Graph D
66.
CLICK ON THE QUESTION TO SEE THE GRAPH AND CLICK AGAIN TO RESTORE IT!

If a line of best fit were drawn, which equation represents the points?  (Choose the BEST answer).
a)
y= 1/3x
b)
y= 1/2x
c)
y= 3x
d)
y= 2x
67.
CLICK ON THE QUESTION TO SEE THE GRAPH AND CLICK AGAIN TO RESTORE IT!

Which is a FALSE statement about this graph?
a)
It shows a positive correlation
b)
It shows the relationship between variable X and variable y
c)
All the data is located in quadrant 1.
d)
The line of best fit shows a slope of 1/2.
68.
CLICK ON THE QUESTION TO SEE THE GRAPH AND CLICK AGAIN TO RESTORE IT!

If Gold's Gym is looking to buy 30 TVs, estimate the cost using this graph. Choose the best answer!
a)
400
b)
750
c)
1250
d)
0
69.
CLICK ON THE QUESTION TO SEE THE GRAPH AND CLICK AGAIN TO RESTORE IT!

The scatterplot shows the relationship between the number of hours a person exercises and the time it takes to drive to work. Which conclusion does the data most strongly support?
a)
The time it takes to drive to work decreases as the number of hours exercising increases.  
b)
The time it takes to drive to work increases as the number of hours exercising increases.  
c)
The time it takes to drive to work stays the same as the number of hours exercising increases.  
d)
The time it takes to drive to work is not related to the number of hours exercising.  
70.
CLICK ON THE QUESTION TO SEE THE GRAPH AND CLICK AGAIN TO RESTORE IT!

As the age of the car increases, its value decreases. Which scatterplot represents this relationship?
a)
A
b)
C
c)
B
d)
D
71.
CLICK ON THE QUESTION TO SEE THE GRAPH AND CLICK AGAIN TO RESTORE IT!

Which scatter plot shows a linear relationship between x and y?
a)
Graph A
b)
Graph B
c)
Graph C
d)
Graph D
72.
CLICK ON THE QUESTION TO SEE THE GRAPH AND CLICK AGAIN TO RESTORE IT!

Look at the line of best fit in each graph.  Which one is the most accurate representation of its data?
a)
A
b)
B
c)
C
d)
D
73.
Use your calculator to determine the type of association.
a)
Linear; Positive association
b)
Linear; Negative association
c)
No association
74.
What is the correlation between length of running start and distance of jump?
a)
positive:  the further you run the further you jump
b)
negative: the less you run the less distance of your jump
c)
positive: the further your running start the less your distance
75.
Which of the following describes a negative association?
a)
As x increases, y increases
b)
As x increases, y decreases
c)
As x increases, y remains constant
76.
Which of the following describes a positive association?
a)
As x increases, y increases
b)
As x increases, y decreases
c)
As x increases, y remains constant
77.
Describe the association of the scatter plot.
a)
Linear; positive association
b)
Linear; negative association
c)
Non-linear
78.
If Gold's Gym paid $250 for each TV, how many did they buy?
a)
35
b)
30
c)
45
d)
20
79.
If the carpenter worked for 6 days, how much did he earn?
a)
1250
b)
1500
c)
1750
d)
2000
80.
What is the correlation between length of running start and distance of jump?
a)
positive:  the further you run the further you jump
b)
negative: the less you run the less distance of your jump
c)
positive: the further your running start the less your distance
81.
About how many male math teachers were there in 2006?
a)
15
b)
30
c)
35
d)
45
82.
A teacher made the following graph showing the number of hours that a student studied for an exam versus their exam grade.  Predict the grade of a student if they studied for 3.5 hours.  
a)
80
b)
100
c)
85
d)
90
83.
The graph shows a line of best fit for data collected on the amount of time teenagers spend on the computer and watching television.  Based on the line of best fit, how much time does a teenager spend watching television if they spend 2 hours on the computer?
a)
150 minutes
b)
135 minutes
c)
165 minutes
d)
180 minutes
84.
Ms. Ochoa recorded the age and shoe size of each student in her physical education class.  This graph shows her data.  Which of the following statements about the graph is true?
a)
The graph shows a positive trend.
b)
The graph shows a negative trend.
c)
The graph shows a constant trend.
d)
The graph shows no trend.
85.
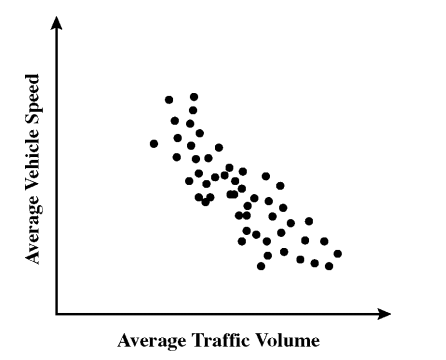
This scatter plot shows the average traffic volume and average vehicle speed on a certain freeway for 50 days in 1999.  Which statement best describes this relationship.
a)
As traffic volume increases, vehicle speed increases.
b)
As traffic volume increases, vehicle speed decreases.
c)
As traffic volume increases, vehicle speed increases at first, then decreases.
d)
As traffic volume increases, vehicle speed decreases at first, then increases.
86.
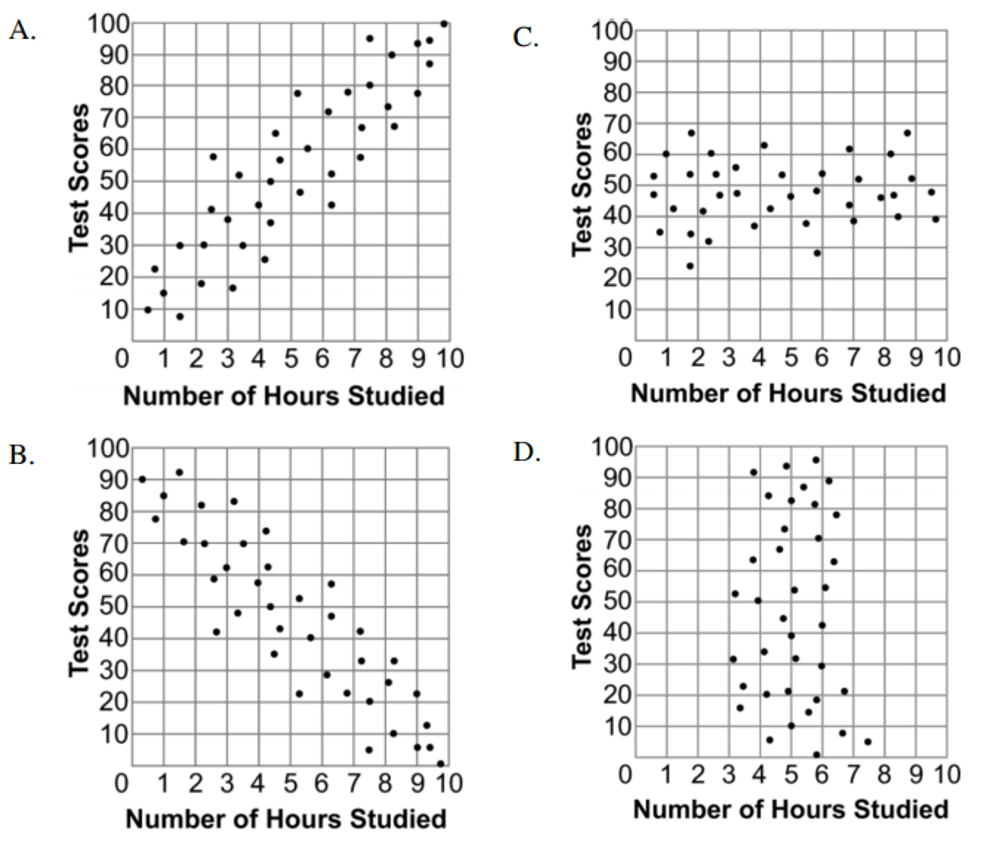
Which graph best shows a positive correlation between the number of hours studied and the test scores?
a)
Graph A
b)
Graph B
c)
Graph C
d)
Graph D
87.
The police department tracked the number of ticket writers and number of tickets issued for the past 8 weeks.  The scatter plot shows the results.  Which statement is true?
a)
More ticket writers results in fewer tickets issued.
b)
There were 50 tickets issued every week.
c)
When there are 10 ticket writers, there will be 800 tickets issued.
d)
More ticket writers results in more tickets issued.
88.
Mr. Thomas wanted to know if the amount of class time that he gave students to study affected their test scores.  What kind of relationship between class study time and test scores is shown on the scatter plot.
a)
No correlation
b)
Positive correlation
c)
Negative correlation
d)
Positive then negative correlation
89.
Which data will most likely show a negative correlation when graphed on a scatter plot?
a)
The outside temperature and the number of people wearing gloves.
b)
The distance a student lives from school and the amount of time it takes to get to school.
c)
The number of visitors at an amusement part and the length of the lines for the rides.
d)
A student's height and grade point average.
90.
Based on the line of best fit for the scatter plot, which of teh following amounts is closest to the cost of a 120-minute phone call?
a)
$10
b)
$12
c)
$15
d)
$20
91.
A group of friends recorded the time it took to ride their bikes around the park.  This scatter plot shows their results with the line of best fit.  Which is closest to the number of minutes it would take to complete 9 laps?
a)
4
b)
5
c)
6
d)
7
92.
The scatter plot shows the relationship between the number of chapters and the total number of pages for several books.  Use the trend line to predict how many chapters would be in a book with 180 pages. 
a)
12 chapters
b)
15 chapters
c)
18 chapters
d)
21 chapters
93.
If Zion works 45 hours a week, how much will his weekly salary be?
a)
about $500
b)
$600
c)
about $700
d)
$1500
94.
The scatterplot represents the heights and weights of a group of people.  Based on the trend line, what would be the weight of a person who is 72 inches tall?
a)
About 180 lbs
b)
About 163 lbs
c)
About 153 lbs
d)
About 145 lbs
95.
Carley's progress from a 5-kilometer race is displayed in the graph.  Based on this scatterplot, if Carley runs in a 4-kilometer race and she maintains the same pace, how many minutes will it take her to run 4 kilometers?
a)
50 minutes
b)
45 minutes
c)
35 minutes
d)
20 minutes
96.
Carlos recorded the weight of several bags of potatoes, and then he counted the number of potatoes in each bag.  The scatterplot represents the relationship between the number of potatoes in a bag and the weight of the bag.  Based on this scatterplot, approximately how many potatoes are in a 15-pound bag?
a)
8 potatoes
b)
15 potatoes
c)
45 potatoes
d)
50 potatoes
97.
The scatterplot shows the costs of new homes in a small Texas town over the last seven years.  Based on this scatterplot, what would be a good prediction for the cost of a new home built in 2008 in Small Town, Texas?
a)
$180
b)
$180,000
c)
$125,000
d)
$210,000
98.
The scatterplot displays the amount of money Amanda earns while babysitting her niece, Emma.  Based on the information in the scatterplot, which statement is a valid conclusion?
a)
As the number of minutes Amanda spends babysitting increases, the amount of money she earns decreases.
b)
As the number of minutes Amanda spends babysitting increases, the amount of money she earns per hour increases.
c)
As the number of minutes Amanda spends babysitting decreases, the amount of money she earns per hour decreases.
d)
As the number of minutes Amanda spends babysitting increases, the amount of money she earns increases.
99.
Joel has been earning money by doing yard work in his neighborhood.  He earns $4.50 per hour.  Which graph represents this relationship and shows the amount of money Joel earns per hour?
a)
A
b)
B
c)
C
d)
D
100.
If the debate team practiced for only 1 hour, how many debates are they expected to win?
a)
2
b)
6
c)
10
d)
14
101.
Is there a correlation between the distance a student lives from school and their test grades?
a)
yes
b)
no
102.
The scatterplot shows the relationship between the number of tickets bought and the amount of money spent buying tickets.  Which would be a reasonable prediction for the cost of buying 6 tickets?
a)
$8
b)
$15
c)
$12
d)
$10
103.
The graph shows the relationship between the amount of gas in a car's tank after going on a trip.  Which is the closest to the amount that would be in the tank after traveling 50 miles?
a)
9 gallons
b)
11 gallons
c)
14 gallons
d)
10 gallons
104.
The graph shows the relationship between the amount of gas in a car's tank after going on a trip.  Which is the closest to the amount that would be in the tank after traveling 90 miles?
a)
9 gallons
b)
7 gallons
c)
10 gallons
d)
8 gallons
105.
Using the line of best fit, what is mostly likely the average for a student that was to get 10 hours of sleep a night?
a)
61
b)
80
c)
99
d)
85
106.
Using the line of best fit, what is most likely the average for a student that was to get 6 hours of sleep?
a)
66
b)
60
c)
80
d)
75
107.
A teacher made the following graph showing the number of hours that a student studied for an exam versus their exam grade.  Predict the grade of a student if they studied for 3.5 hours.  
a)
80
b)
100
c)
85
d)
90
108.
What represents the x axis?
a)
ABC Company
b)
Hours Worked
c)
Amount Earned in Dollars
d)
Hours in Car
109.

What is the mean absolute deviation of 13, 14, 17, 28, and 28?

a)

6.4

b)

8.6

c)

4.6

d)

6.3

110.

What is the Mean and Mean Absolute Deviation of 24, 13, 12, 1, and 0?

a)

Mean:10

Mad:6.7

b)

Mean: 7.6

MAD:10

c)

Mean:10

MAD:7.6

d)

Mean-6.7

MAD-7.6

111.

What does M.A.D stand for?

a)

Mean as Dirt

b)

Mean Average Deviation

c)

Crazy

d)

Mean Absolute Deviation

112.

Which is the correct Mean and Mean Absolute Deviation to the following numbers?


0, 0, 5, 6, 9 and 2

a)

Mean: 3.66

MAD:3

b)

Mean: 3

MAD:3.66

c)

Mean:3

MAD:4

d)

None of the above

113.

What is the Mad?


4,32,33,45,67

a)

33

b)

15.84

c)

18

d)

15.9

114.

What is the Mean Absolute Deviation to the nearest tenth?


44,46,47,50,and 45

a)

2.0

b)

1.0

c)

1.7

d)

1.68

115.

What is the correct Mean and Mean Absolute Deviation?


33,67,78,90,99,87

a)

Mean:75.6

Mad:17

b)

Mean:75.6

Mad:17.1

c)

Mean:17.1

Mad:75.6

d)

Mean:18

Mad:77

116.

True or false? :The larger the Mean Absolute Deviation the more consistent the data is.

a)

True

b)

False

117.

True or false?:The absolute value of a number will always be positive.

a)

True

b)

False

118.

Find the Mean Absolute Deviation: 10, 9, 3, 8, 10. The Mean is 8

a)

3

b)

1

c)

5

d)

2

119.

Find the MAD: (mean absolute deviation)

58, 38, 54, 48, 26, 36

a)

10

b)

20

c)

12

d)

43

120.

Find the MAD for the following set: 85, 90, 68, 75, 79

a)

79.4

b)

6.48

c)

32.4

d)

79

121.
Calculate the Mean Absolute Deviation 156, 189, 134, 220, 138, 192
a)
171.5
b)
28.8
c)
35
d)
25
122.
Calculate the average/mean of the following data 33, 56, 66, 71, 84, 110
a)
60
b)
70
c)
80
d)
90
123.
Find the M.A.D. of this data set. Round your answer to the nearest tenth.
a)
5
b)
3.75
c)
5.1
d)
4.3
124.
Data set 1 has a M.A.D. of 2.3 and Data set 2 has a M.A.D. of 2.5. Which data set has less variability?
a)
Data Set 1
b)
Data Set 2
125.
Fill in the blank with the accurate statement.
The _________  M.A.D has the ______ variation in its data set. 
a)
smaller, larger
b)
smaller, same amount of
c)
bigger, smaller
d)
bigger, larger
126.

Find the Mean Absolute Deviation for the set of data:

75, 89, 80, 145, 85

a)

100.4

b)

94.8

c)

20.08

d)

474

127.
The scatter plot shows the relationship between the number of chapters and the total number of pages for several books.  Use the trend line to predict how many chapters would be in a book with 180 pages. 
a)
12 chapters
b)
15 chapters
c)
18 chapters
d)
21 chapters
128.

Based on the graph, if Joe earned $400, how many hours did he work?

a)

25 hours

b)

35 hours

c)

45 hours

d)

15 hours

129.
Calculate the M.A.D:  13, 17, 19, 27
a)
4
b)
19
c)
6
d)
8
130.
Determine the mean absolute deviation of the data:
 9, 7, 11, 10, and 8
a)
9
b)
6
c)
1.2
d)
5