Wayground logo

Free Printable Worksheets

Font size

S
M
L
XL
Worksheets

Data

Total questions: 50

Worksheet time: 47mins
Name
Class
Date
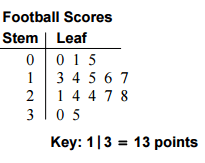
1.
How many games did the team play?
a)
15
b)
12
c)
24
d)
14
2.
How many students scored more than 80%?
a)
10
b)
2
13
c)
7
d)
15
3.
In how many games did the team score more than 20 points?
a)
8
b)
7
c)
10
d)
9
4.
What is the minimum in this data set?
a)
0
b)
4
c)
9
d)
40
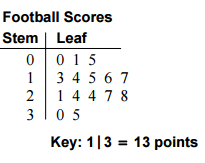
5.
What is wrong with this stem and leaf diagram?
a)
Nothing- it's all correct.
b)
The order.
c)
It's missing a key.
d)
The title.
6.
1. Which of the following best describes the process of finding the range for a set of data?
a)
ADD the biggest and smallest numbers
b)
Place the number in order from least to greatest then find the middle.
c)
Find the difference between the Maximum and the Minimum.
d)
Find the average.
7.
How many employees are there that make between $33,000 and $43,000
a)
250
b)
500
c)
550
d)
750
8.
Which interval shows the greatest number of pets?
a)
15-19
b)
0-4
c)
5-9
d)
10-14
9.
Each dot represents 1 day. How many days were recorded?
a)
9
b)
21
c)
20
d)
105
10.
What is the mode of the trout weight?
a)
450
b)
450.5
c)
452
d)
460
11.
What is the minimum value?
a)
64
b)
58
c)
66
d)
60
12.
What is the maximum value?
a)
58
b)
66
c)
64
d)
60
13.
What data value is the upper quartile (Q3)?
a)
64
b)
62
c)
66
d)
58
14.
Roger bowled 7 games last weekend. His scores are: 155, 165, 138, 172, 127, 193, 142. What is Roger's median score?
a)
127
b)
155
c)
156
d)
193
15.
What value is the lower quartile?
a)
66
b)
58
c)
60
d)
64
16.
What is the interquartile range (IQR)?
a)
4
b)
64
c)
60
d)
8
17.
Which box and whisker plot has the highest median?
a)
Top plot
b)
Bottom plot
18.

Which has a lower median?

a)

Florida

b)

Texas

19.

Which has a greater median?

a)

Week 1

b)

Week 2

20.

True or False: Week 2 median is the same as Week 1 Q3

a)

False

b)

True

21.

Which has a greater IQR? (Interquartile Range)

a)

6th graders

b)

4th graders

22.
What is the highest score in the class?
a)
88%
b)
100%
c)
13
d)
98%
23.
How many students received a score in the 80's?
a)
2
b)
10
c)
14
d)
27
24.
What is the MODE of this data?
a)
90
b)
85, 90, and 95
c)
85 and 95
d)
None
25.
What is the MEDIAN of this data?
a)
65
b)
40
c)
915
d)
13
26.
The mode is
a)
The middle score
b)
 Scores added & divided by the number of scores
c)
The most frequent score
d)
The middle when in order
27.
The median is
a)
The middle score
b)
 Scores added & divided by the number of scores
c)
The most frequent score
d)
The middle when in order
28.
Find the mean of these numbers:
5,11,2,12,4,2
a)
4.1
b)
6
c)
4.5
d)
4
29.
Identify the outlier for the given data?
23, 34, 27, 7, 30, 26, 28, 31, 34
a)
7
b)
23
c)
31
d)
34
30.

Find the mode of these numbers:

4,3,6,4,3,6,6,3,2,1,3

a)

3

b)

6

c)

4

d)

2

31.

What is true about the data in this bar graph?

a)

In this perfectly symmetrical distribution, the mean, median, and mode are the same.

b)

The mean, median, and mode are different.

c)

There are several outliers in the set of data that makes this bar graph.

d)

The data is unevenly distributed - therefore, the mean, median, and mode are are all over the place.

32.
21. How many students are represented by the histogram?  
a)
Cannot be determined
b)
9
c)
31
d)
35
33.
What is the least value?
a)
52
b)
0
c)
13
d)
10
34.
More people had between __ and __ cups of coffee than any other range.
a)
0-3
b)
8-11
c)
12-15
d)
16-19
35.
What is the mean?
a)
The number that occurs the most
b)
The number in the middle
c)
The difference between the highest and lowest values
d)
The Average
36.
What is the median?
a)
The number in the middle
b)
The difference between the highest and lowest values
c)
The number that occurs the most
d)
The average
37.
When finding the median what is the FIRST step?
a)
Mark off the lowest number
b)
Mark off the highest number
c)
Find the Middle
d)
Arrange the number from Least to Greatest
38.
At Donald's Donuts the number of donut holes in a bag can vary. Help Donald find the mode.
12,10,10,10,13,12,11,13,10
a)
13
b)
12
c)
11
d)
10
39.
A data set can have more than one mode
a)
True
b)
False
40.
A data set can have more than one median?
a)
True
b)
False
41.
To find the average of a set of numbers, add up all the items and divide by...
a)
2
b)
The minimum
c)
The maximum
d)
The number of items
42.
What is the range?
a)
average
b)
biggest-smallest
c)
the middle #
d)
# happening the most
43.
It is possible to have three numbers in the middle of a data set.
a)
True
b)
False
44.
Given the set of data below, what would be the most meaningful measure?
1, 1, 1, 1, 1, 1, 1, 1, 1, 21
a)
Mean
b)
Median
c)
Mode
d)
Range
45.
The dot plots compare the number of raffle tickets sold by boys and girls during a school fund-raiser. Which plot has an outlier? 
a)
Girls
b)
Boys
c)
Both Plots
d)
Neither
46.
What is the range in gas mileage for cars?
a)
2
b)
3
c)
4
d)
6
47.
Which statement correctly describes the shapes of the dot plots for cars and SUVs?
a)
SUVs: symmetrical
Cars: skewed left
b)
Both are skewed left
c)
Both are symmetrical
d)
SUVs: skewed right
Cars: Skewed left
48.
What is the highest score in the class?
a)
88%
b)
100%
c)
13
d)
98%
49.
What is the range of the data shown?
a)
85
b)
90
c)
80
d)
70
50.

In order to receive a 100 for a test grade, tell me what do you plan on getting on STAAR this year and how will you get there.

a)

I will get Approaches(below grade level but passing) because I only look at Math during class ONLY.

b)

I will get Meets( on grade level), because I will ask questions in class and do some studying outside of class.

c)

I will just do my best.

d)

I will get Advance(commended) because I will actively participate in class and will study outside of class, and come to tutoring if I need too.