wayground logo

Free Printable Worksheets

NEW

Font size

S
M
L
XL
Worksheets

2/5/20 Scatter Plots & Reading Other Graphs

Total questions: 50

Worksheet time: 2hrs 40mins

Name
Class
Date
1.
Which sentence describes the relationship shown on this scatter plot?
a)
As the temperature decreases, the visitors increase. 
b)
As the temperature increases, the number of visitors increases. 
c)
As the visitors increase, the temperature decreases. 
d)
No correlation
2.
What type of association does this scatter plot represent?
a)
positive linear association
b)
negative linear association
c)
no association
d)
nonlinear association
3.
What type of association (correlation) does this graph have?
a)
positive 
b)
negative
c)
none
d)
all of the above
4.
What type of correlation does this graph have?
a)
positive
b)
negative
c)
none
d)
all of the above
5.
What is the type of correlation?
a)
Negative 
b)
no association
c)
positive 
6.
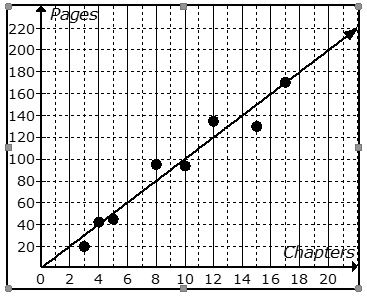
The scatter plot shows the relationship between the number of chapters and the total number of pages for several books.  Use the trend line to predict how many chapters would be in a book with 140 pages. 
a)
12 chapters
b)
19 chapters
c)
14 chapters
d)
21 chapters
7.
About how many male math teachers were there in 2006?
a)
15
b)
30
c)
35
d)
45
8.
What is a scatter plot?
a)
A graph that shows the relationship of two data sets.
b)
A graph drawn using rectangular bars to show how large each value is.
c)
A graph that shows information that is connected in some way.
d)
A graph that shows data changing over time.
9.
Which scatter plot shows a linear relationship between x and y?
a)
Graph A
b)
Graph B
c)
Graph C
d)
Graph D
10.
As the age of the car increases, its value decreases. Which scatterplot represents this relationship?
a)
A
b)
B
c)
C
d)
D
11.
Based on the graph, if Joe earned $400, how many hours did he work?
a)
25 hours
b)
35 hours
c)
45 hours
d)
15 hours
12.
How many total people took the survey?
a)
50
b)
150
c)
100
d)
200
13.
What is the range of the data?
a)
4
b)
8
c)
6
d)
2
14.
Which fitness club has the greater range?
a)
Fun Fit
b)
Greg's Gym
c)
Neither
15.
What is the range?
a)
average
b)
biggest-smallest
c)
the middle #
d)
# happening the most
16.
In order to find the median, the data must be sorted from least to greatest first.
a)
True
b)
False
17.
What is the mode?
a)
# happening the most
b)
the average
c)
biggest - smallest
d)
the middle #
18.
To find the average of a set of numbers, add up all the items and divide by...
a)
2
b)
The minimum
c)
The maximum
d)
The number of items
19.
What was the total amount of candy sold during the school year shown in the graph?
a)
43
b)
35.5
c)
23
d)
27.5
20.
What was the difference between Hannah's rehearsal time on Monday and Tuesday?
a)
0
b)
50
c)
30
d)
80
21.
In August, how many metric tons did Clark's Paper Mill and Tyler Paper Mill produce all together?
a)
10
b)
70
c)
80
d)
90
22.
Which country doubled the amount of aid their received between 1965 and 1975?
a)
Egypt
b)
Tunisia
c)
Pakistan
d)
None of them
23.

What does this graph show?

a)

Dogs on a leash

b)

Students

c)

Popcorn sold

d)

Teachers

24.

What day was the MOST popcorn sold?

a)

Monday

b)

Tuesday

c)

Wednesday

d)

Thursday

25.

What day was the LEAST popcorn sold?

a)

Monday

b)

Tuesday

c)

Wednesday

d)

Thursday

26.

What does this graph show?

a)

Number of basketballs

b)

Number of Slam Dunks

c)

Number of teams

d)

Number of people

27.

How many slam dunks did the Bulls score?

a)

2

b)

4

c)

6

d)

8

28.

What does this graph show?

a)

Ice Cream sold

b)

Days of the week

c)

Cats on cars

d)

Ice Cream melted

29.

How many cones did orange sell?

a)

2

b)

4

c)

6

d)

8

30.
What type of graph/chart is this?
a)
Bar Graph
b)
Line Graph
c)
Pie Chart
d)
Infographic 
31.
What is this graph showing you?
a)
The worlds population is staying the same.
b)
The worlds population is going down (decreasing).
c)
The worlds population was growing but now is decreasing.
d)
The worlds population has been growing and will continue to grow. 
32.
In what year did the world population reach 3 billion people?
a)
1970
b)
1950
c)
1960
d)
1990
33.
What is the world population expected to be in 2040?
a)
9 Billion 
b)
13 Billion
c)
7 Billion
d)
16 Billion
34.

The vertical axis of a line graph is called the __________.

a)

slope

b)

line of best fit

c)

x-axis

d)

y-axis

35.

A _________ is a pair of numbers used to determine the position of a point on a graph.

a)

coordinate

b)

line of best fit

c)

straight

d)

x-axis

36.

In a linear graph , the data points yield a curved line.

a)

true

b)

false

37.
a)

The cooler the temperature, the louder the crickets chirp.

b)

The crickets cannot chirp at temperatures lower than 10 degrees C.

c)

The warmer the temperature, the more often crickets chirp.

d)

The temperature and the chirping of crickets are not related.

38.
How many people have two or less books in their desk?
a)
4
b)
5
c)
6
d)
7
39.

Based on the graph, how many more students are in the science club than the book club?

a)

20

b)

16

c)

46

d)

18

40.

The graph shows how employees at Disney World travel to work. How many employees ride bikes, ride the bus, or walk to work?

a)

300

b)

450

c)

325

d)

375

41.

The graph shows how employees at Disney World travel to work. How many employees ride bikes, ride the bus, or walk to work?

a)

300

b)

450

c)

325

d)

375

42.

The bar graph shows data about the pets owned by math students in four classes. One bar is missing from the graph. If the students have a total of 32 dogs, which bar shows the number of dogs Ms. Davalos's class has?

a)
b)
c)
d)
43.

Did more people own a Wii or a PS3?

a)

Wii

b)

PS3

44.

What is the difference in the number of people who owned a Wii and the number who owned a Gameboy?

a)

4

b)

7

c)

3

d)

2

45.

Which month had the greatest number of books read?

a)

November

b)

December

c)

January

d)

February

46.

Which month had the fewest books read?

a)

January

b)

February

c)

March

d)

April

47.
What is the difference between the highest score and the lowest score on the test?
a)
15
b)
100
c)
6
d)
10
48.
Which day of the week had the lowest high and low temperature?
a)
Monday
b)
Thursday
c)
Tuesday
d)
Wednesday
49.
Which day had more minutes of homework?
a)
Wednesday
b)
Thursday
c)
Friday
d)
Ms. Jones
50.
How many more people have purple for a favorite color than red?
a)
3
b)
5
c)
7
d)
9