
 Worksheets
4A Linear Review: Slope, Slope-Intercept, Horizontal, and Vertical
Total questions: 50
Worksheet time: 3hrs 47mins
What is the Slope Intercept Formula
ax + by = c
y = mx + b

What is the Slope Formula?
ax + by = c
y = mx + b
(6,7) and (4,2)
(2, 4) and (6, 12)
(10, 1) and (5, 2)
What is the slope of the line that passes through the points (5, 3) and (5, -9)
0
undefined
-6/5
6/5

-5/2

What is the Slope represented in this table?
slope: −41
slope: −4
slope: 41
slope: 4


1/3 cup per second
3 cups per second
1/3 second per cup
3 seconds per cup
Which are the correct steps to graphing an equation?
1) Plot your "b" on the y-axis.
2) From the point, you will use the "m" by doing run/rise. Place a dot here.
3) Draw your line.
1) Plot your "b" on the y-axis.
2) From the point, you will use the "m" by doing rise/run. Place a dot here.
3) Draw your line.
1) Plot your "b" on the y-axis.
2) From the origin, you will use the "m" by doing rise/run. Place a dot here.
3) Draw your line.
1) Plot your "b" on the x-axis.
2) From the point, you will use the "m" by doing rise/run. Place a dot here.
3) Draw your line.
1) Plot your "b" on the x-axis.
2) From the point, you will use the "m" by doing run/rise. Place a dot here.
3) Draw your line.
What would be the correct way to graph:
y=−53x+1 ?
b = -1
m = 53
1) Go to -1 on the y-axis and place a dot.
2) From this point go up 3 and right 5. Place a dot.
3) Draw your line.
b = 1
m = −53
1) Go to 1 on the x-axis and place a dot.
2) From this point go down 3 and right 5. Place a dot.
3) Draw your line.
b = 1
m = −53
1) Go to 1 on the y-axis and place a dot.
2) From this point go down 3 and left 5. Place a dot.
3) Draw your line.
b = 1
m = −53
1) Go to 1 on the y-axis and place a dot.
2) From this point go down 3 and right 5. Place a dot.
3) Draw your line.
What would be the correct way to graph:
y = -3x - 2?
b = -2
m = 1−3
1) Go to -2 on the y-axis and place a dot.
2) From this dot, go down 3 and right 1. Place a dot.
3) Draw your line.
b = -2
m = 1−3
1) Go to -2 on the y-axis and place a dot.
2) From this dot, go down 3 and left 1. Place a dot.
3) Draw your line.
b = -2
m = 1−3
1) Go to -2 on the x-axis and place a dot.
2) From this dot, go down 3 and right 1. Place a dot.
3) Draw your line.
b = -2
m = 1−3
1) Go to -2 on the y-axis and place a dot.
2) From the origin go down 3 and right 1. Place a dot.
3) Draw your line.
b = -2
m = -3
1) Go to -2 on the y-axis and place a dot.
2) From this dot, go down 3. Place a dot.
3) Draw your line.
Graph the line with the equation
y = −32x + 4


Which graph is correct for the given equation?


Which is the graph of the equation y = -2x + 1?


Which graph represents 2x + 4y = 12?


Which graph represents the equation x+5y=5


Which describes the correct line and shade for each inequality?


You cannot tell without the numbers.
What is the graph of the linear inequality:


What is the graph of the linear inequality:


Which graph best represents the following inequality?


Graph 5x - 2y < 10


−x − y≥1


If b = 6 and m = 3, what is the correct slope intercept equation?

Write the equation of the graph in slope-intercept form
y=−2x−4
y=2x − 4
y=21x−4
y=−21x−4

What is the graph's equation?
y = 4/3x - 1
y = -4/3x - 1
y = 3/4x + 1
y = - 3/4x - 1


Janet wrote that the equation of this line was
y=3−2x+4 . Is she correct? Why or why not?
Yes she is correct.
No, the y-intercept should be 5. The equation should be: y=3−2x+5.
No, the slope is 3/2. The equation should be:
y=23x+4.
No, the slope is -3/2. The equation should be:
y=2−3x+4.
No, the slope is 2/3. The equation should be:
y=32x+4.


This is a graph of which inequality?
y > 4x - 2
y > -2x + 4
y < -2x
y < 4X - 2

According to the graph, which point is a solution? Choose all that apply.
y>−32x−1
y<−32x−1
y>−23x−1
y≥−32x−1

What is the inequality to the graph? In which quadrants does the solution lie?
y ≤ 2x - 4
Quadrants 1, 3, and 4.
y ≥ 2x - 4
Quadrants 1, 3, and 4.
y < 2x - 4
Quadrants 1, 3, and 4.
y ≤ 2x - 4
Quadrants 1, 2, and 3.
y ≥ 2x - 4
Quadrants 1, 2, and 3.
What direction is a 0 slope?
Find the graph for the equation below,
y = 5


Find the graph for the equation,
x = −5


What is the equation of the graph shown here?
x = 8
y = 8
x = -8
y = -8

x>−3
x≥−3
x≤−3
x≤−3
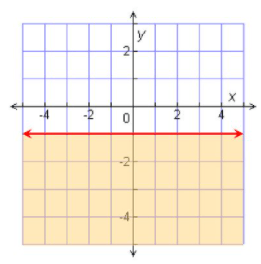
Choose the correct inequality for this graph.
y<−1
y≤−1
x<−1
x≤−1
What would the graph of y = 8x look like?

