
 Worksheets
Georgia Milestones 8th Grade Math Review
Total questions: 70
Worksheet time: 2hrs 58mins


[10, -5, 3, 16, -1, 0, 1]


Look at the number line.


Find the length of the missing side.
20 in.
68 in.
16 in.
80 in.


V=πr2h


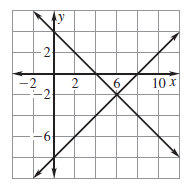


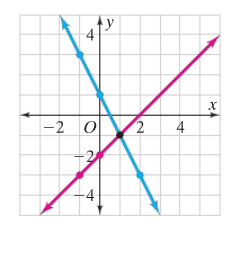


5x + 3y = 7
y = 4
2x − 3y = −1
y = x − 1

What type of correlation does this graph have?
Negative
no association
positive

What type of correlation does this graph have?
positive
negative
none
all of the above

Mrs. Collins made a scatterplot to show the relationship between the number of absences and a student’s final exam score. Based on this scatterplot, a student with 12 absences should get approximately what score on the final exam?
60
92
70
76

Which sentence describes the relationship shown on this scatter plot?
As the temperature decreases, the visitors increase.
As the temperature increases, the number of visitors increases.
As the visitors increase, the temperature decreases.
No correlation

Describe the correlation in the graph shown.
Strong Negative
Strong Positive
Weak Negative
Weak Positive

Write an equation for the given scatter plot.
y=2x+8
y=1x
8x-4y=10
y=7

Mrs. Collins made a scatterplot to show the relationship between the number of absences and a student’s final exam score. Based on this scatterplot, a student with 6 absences should get approximately what score on the final exam?
85
92
70
76

The scatter plot shows the relationship between the number of chapters and the total number of pages for several books. Use the trend line to predict how many pages would be in a book with 19 chapters.
150 pages
170 pages
190 pages
210 pages

Mrs. Collins made a scatterplot to show the relationship between the number of absences and a student’s final exam score. Based on this scatterplot, a student with 6 absences should get approximately what score on the final exam?
65
92
70
76



