
 Worksheets
Graphs, Tables, and Charts Review
Total questions: 44
Worksheet time: 39mins




Based on the data in the table, how many students played the three games that had the highest frequency?
62
57
60
61

The stem and leaf plot shows the scores of eight people at a poster making contest. What is the difference between the highest score and the lowest score?
2.9
2.7
29
27

The dot plot shows the number of books students in Mr. Stafford's class read during a summer reading contest. What fraction of the students in this class read four or more books?
eleven twenty-eighths
three sevenths
five fourteenths
three twenty-eighths

The number of minutes that band members practiced last night are shown in the stem and leaf plot. What is the difference between the least number of minutes a band member practiced and the greatest number of minutes a band member practiced?
51
46
56
61

The scatterplot shows the amount of rainfall during six thunderstorms and the length of time that each storm lasted. Based on the scatterplot, which statement is true?
During each storm that lasted longer than 1 hour, there was less than 1 inch of rain.
During each storm that lasted longer than 1 hour, there was more than 1 inch of rain.
No storms produced more than 2 inches of rain.
No storms lasted longer than 1 hour.

The distance in meters jumped by ten long jumpers at a track meet are shown in the stem and leaf plot. What is the combined number of meters jumped by the three longest jumpers.
16.4
17.3
16.6
17.1

What fraction of the children are at least four years old?
9/25
3/8
1/3
1/6

How many more people voted for Garza than Price and Turner combined?
8
26
23
33

The bar graph shows data about the pets owned by math students in four classes. One bar is missing from the graph. If the students have a total of 32 dogs, which bar shows the number of dogs Ms. Davalos's class has?


Which month had the greatest number of books read?
November
December
January
February

Which month had the fewest books read?
January
February
March
April

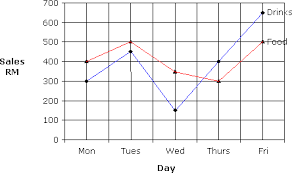

Which month had the biggest difference between the high and low temperatures?
January
April
October
November

An outlier is..
a number that is repeated the most in the data.
a number that is the highest in the data.
a number that is the lowest in the data.
a number that is either much greater than or less than any other numbers in the data.

Which shape was the most favorite?

Which shape was the least favorite?


How many boys AND girls have shoes that are 20 centimeters long?
8
9
17
10

How many total students were surveyed?
64
60
24
54

How many boys were surveyed?
20
29
30
35

Students were surveyed about their favorite sports to play in phys.ed. The results are represented in this circle graph. If 48 students were surveyed, how many chose soccer?
10
12
15
14

