wayground logo

Free Printable Worksheets

NEW

Font size

S
M
L
XL
Worksheets

1st year Statistics

Total questions: 46

Worksheet time: 3hrs 26mins

Name
Class
Date
1.
The entire group of objects or individuals considered for a survey.
a)
biased sample
b)
population
c)
random sample
d)
sample
2.
A part of the population.
a)
biased sample
b)
population
c)
random sample
d)
sample
3.
A sample that does not fairly represent the population.
a)
population
b)
biased sample
c)
random sample
d)
sample
4.

In which month were you born?

a)

Categorical

b)

Numerical

5.

What is your favorite subject in school?

a)

Categorical

b)

Numerical

6.

How old are you?

a)

Categorical

b)

Numerical

7.
Which one of the following survey questions would generate numerical data?
a)
What is your favourite colour?
b)
What type of car does your family own?
c)
How long does it take for you to travel to school?
d)
What type of dog do you own?
8.
Which one of the following survey questions would generate categorical data?
a)
How many times do you eat at your favourite fast-food place in a typical week?
b)
How much do you usually spend buying your favourite fast food?
c)
How many items did you buy last time you went to your favourite fast food place? 
d)
Which is your favourite fast food?
9.
How many people have two or less books in their desk?
a)
4
b)
5
c)
6
d)
7
10.
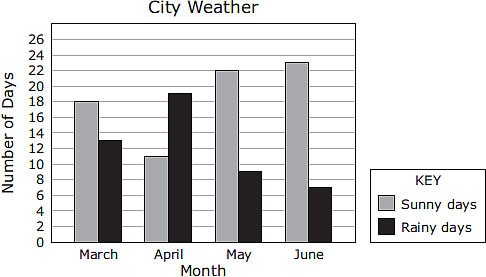
The graph below shows the number of sunny days and rainy days in a city during four months.

Based on the graph,how many more sunny days than rainy days did this city have during the months of April, May, and June?
a)
21
b)
56
c)
26
d)
20
11.

For how many weeks was the data collected?

a)

48

b)

50

c)

52

d)

54

12.
How many people purchased no food and no drink?
a)
60
b)
10
c)
20
d)
200
13.
How many students spent over 40 minutes but under 60 minutes studying?
a)
22 Students
b)
30 Students
c)
8 Students
d)
5 Students
14.
How many scores are listed in this Stem and Leaf Plot?
a)
3
b)
6
c)
9
d)
18
15.
In how many games did the team score more than 20 points?
a)
8
b)
7
c)
10
d)
9
16.

How many times did Mary score below a 60 on her tests?

a)

4

b)

5

c)

3

d)

0

17.
How many total people took the survey?
a)
50
b)
150
c)
100
d)
200
18.
What is the highest score in the class?
a)
88%
b)
100%
c)
13
d)
98%
19.
How many students scored 93% or less?
a)
6
b)
16
c)
14
d)
13
20.
Which interval has 400 employees?
a)
33-43
b)
0-10
c)
77-87
d)
66-76
21.
How many students are between 60 and 63 inches tall?
a)
3
b)
0
c)
12
d)
7
22.
The team scored 50 points. How many points did Kendrick score?
a)
12 points
b)
20 points
c)
10 points
d)
72 points
23.
A survey should always be ____ and ____.
a)
random and biased
b)
random and unbiased
24.
Ana wants to know the average student’s opinion of the tardy policy at her school. Which group of students should she survey in order to achieve the most accurate results?
a)
thirty students who are often tardy
b)
thirty students who are rarely tardy
c)
thirty of her friends
d)
thirty randomly selected students from her school
25.
A sample should be
a)
representative of  only middle school students only
b)
a very large group
c)
representative of the population
d)
representative of people who volunteer
26.

The Student Council asked every tenth student in the lunch line how they preferred to be contacted with school news. The results are shown in the table. Is this an unbiased sample? If yes, suppose there are 684 students at the school. How many can be expected to prefer E-mail?

a)

No, it's a biased sample

b)

432

c)

304

d)

16

27.

A hospital wants to open a gym. They ask the night-shift ER staff when they would use the gym.

a)

Biased

b)

Unbiased

28.

To determine the number of umbrellas the average household in the United States owns, a survey of 100 randomly selected households in Arizona is conducted. Of the households, 24 said that they own 3 or more umbrellas. The researcher concluded that 24% of the households in the United States own 3 or more umbrellas. Is the this a valid conclusion? Justify your answer.

a)

Valid. The sample is biased.

b)

Not valid. The sample is biased.

c)

Valid. The sample is unbiased.

d)

Not valid. The sample is unbiased.

29.

Is this an example of a population or a sample?


The number of pets in all households in a city.

a)

population

b)

sample

30.

Is this an example of a population or a sample?


The number of pets in one household in a city.

a)

population

b)

sample

31.

Is this sample biased or unbiased?


A sample of 50 students who currently have an A in math.

a)

Biased

b)

Unbiased

32.

Look at the bar graph.


How many dogs do the students have?

a)

7

b)

6

c)

5

33.

Do they have more fish or cats?

a)

Fish

b)

Cats

34.

Use the data in the graph to make an inference.


If Hector has to close his shop either Thursday, Friday, Saturday, or Sunday, what day should he close it?

a)

Friday

b)

Sunday

c)

Thursday

d)

Saturday

35.
How many total votes were collected?
a)
5
b)
10
c)
15
d)
20
36.
Which pizzeria has the second largest sales? 
a)
Pizza House
b)
Domiano's Pizza
c)
Little Secrets Pizza
d)
Uncle John's Pizza
37.

How many students take the bus to school?

a)

35

b)

20

c)

10

d)

15

38.
How many people voted for red as their favourite colour?
a)
100
b)
2
c)
4
d)
9
39.
What is the range in gas mileage for cars?
a)
2
b)
3
c)
4
d)
6
40.

Write the equivalent decimal of 6%

a)

60.0

b)

6.0

c)

0.6

d)

0.06

41.

Write the equivalent percent for 0.055

a)

5.5%

b)

0.055%

c)

0.55%

d)

55%

42.

How many drivers were interviewed regarding their preferred vehicle?

a)

156

b)

84

c)

240

d)

180

43.

What percent of the drivers interviewed are female?

a)

180%

b)

75%

c)

0.75%

d)

180%

44.
-information being collected
a)
data
b)
variability
c)
tally
d)
graph
45.

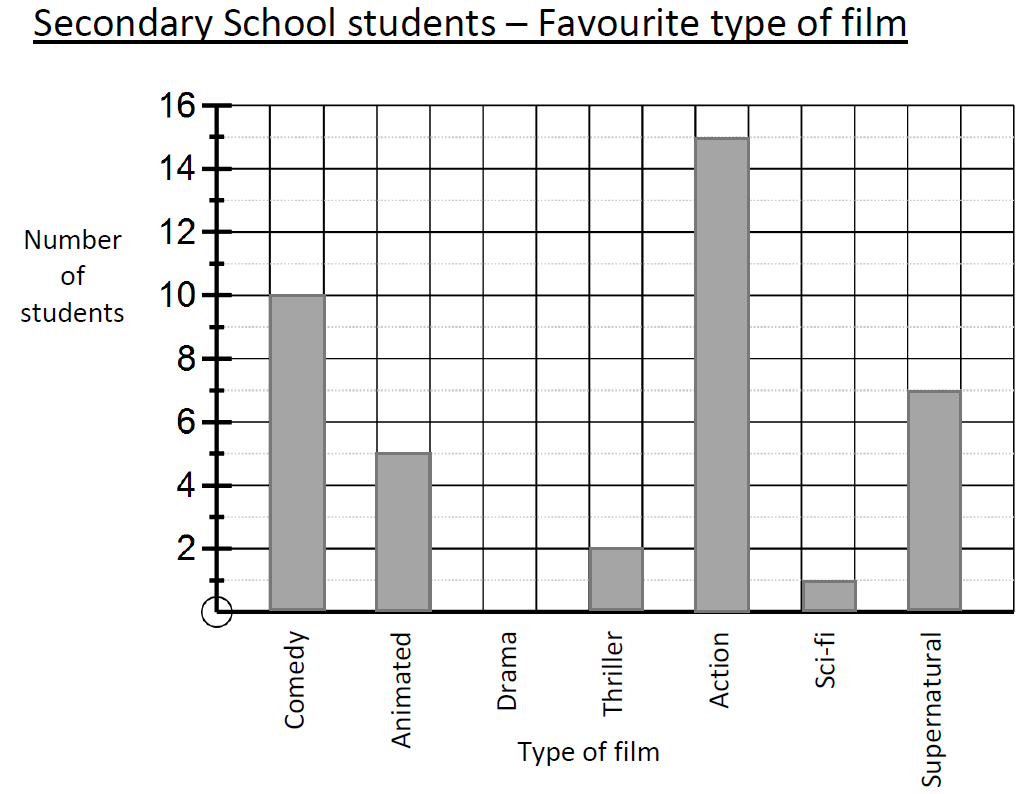
What was the most popular type of film?

a)

Action

b)

Comedy

c)

Supernatural

d)

Animated

46.
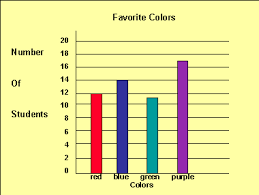
How many more people have purple for a favourite colour than red?
a)
3
b)
5
c)
7
d)
9