wayground logo

Free Printable Worksheets

NEW

Font size

S
M
L
XL
Worksheets

Correlation and Linear Regression

Total questions: 30

Worksheet time: 43mins

Name
Class
Date
1.

Estimate the correlation coefficient for this scatterplot.

a)

A) r = 1.2

b)

B) r = 0.89

c)

C)r = 0

d)

D) r = -0.89

2.

Describe the correlation in the graph shown.

a)

A) Strong Negative

b)

B) Strong Positive

c)

C) Weak Negative

d)

D) No Correlation

3.

Estimate the correlation coefficient for this scatterplot.

a)

A) r = -0.9

b)

B) r = 1

c)

C) r = 0.9

d)

D) r = -1

4.

Describe the relationship between the variables.

a)

A) Weak positive correlation

b)

B) Weak negative correlation

c)

C) Strong positive correlation

d)

D) Strong negative correlation

5.

Which with is the line of best fit?

a)

A) Black

b)

B) Orange

c)

C) Red

d)

D) Blue

6.

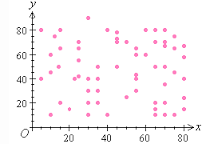
What type of correlation does this graph show?

a)

A) Positive

b)

B) negative

c)

C) none

d)

D) all of the above

7.

As x increases, y decreases.

a)

A) no correlation

b)

B) negative correlation

c)

C) correlation coefficient

d)

D) positive correlation

8.

As x increases, y increases

a)

A) correlation coefficient

b)

B) causation

c)

C) positive correlation

d)

D) negative correlation

9.

The scatter plot below shows the number of books read by students in Mrs. Hall’s English class and their final grades. Which statement represents the best description about the line of best fit?

a)

A) The more books students read, the lower their English grade.

b)

B) The more books students read, the higher their English grade.

c)

C) The fewer books students read, the higher their English grade.

d)

D) No relationship exists between the number of books students read and their English grades.

10.

The scatter plot shows the number coffee shops in different cities and the number of violent crimes. Which of the following is NOT true?

a)

A) As the number of coffee shops increase, violent crimes appears to increase.

b)

B) The line of best fit (regression line) shows a positive correlation

c)

C) The data has a positive correlation coefficient

d)

D) An increase in coffee shops causes an increase in violent crimes

11.
Graph has a slope of 1/2 and a y- intercept of 1.  Write the equation in slope - intercept form
a)
y = 1x
b)
y = 1/2x + 1
c)
y = 2x + 1
d)
y = -2x + 1
12.
Describe the correlation in the graph shown.
a)
Strong Negative
b)
Strong Positive
c)
Weak Negative
d)
Weak Positive
13.
Which scatter plot shows a linear relationship between x and y?
a)
Graph A
b)
Graph B
c)
Graph C
d)
Graph D
14.
What letter do we use to represent correlation coefficient?
a)
c
b)
r
c)
p
d)
h
15.
A person travels by car.  They record their miles driven in a data table.  Identify the x-variable (input) of the data.
a)
Time (hours)
b)
Distance (miles)
16.
A person travels by car.  They record their miles driven in a data table.  Identify the y-variable (output) of the data.
a)
Time (hours)
b)
Distance (miles)
17.
The linear regression equation is y = 61.93x - 1.79.  Identify the y-intercept of the equation.
a)
Y-Int = 61.93
b)
Y-Int = -1.79
c)
Y-Int = (0, -1.79)
d)
Y-Int = (0, 61.93)
18.
The linear regression equation is y = 61.93x - 1.79.  According to the equation, the y-intercept can be interpreted as:
a)
After 0 hours of driving, they went -1.79 miles.
b)
They are driving -1.79 miles per hour.
c)
They drove 1.79 miles total.
d)
They drive 1.79 hours total.
19.
The linear regression equation is y = 61.93x - 1.79.  Identify the slope of the equation.
a)
Slope = 61.93
b)
Slope = -1.79
c)
Slope = (0, -1.79)
d)
Slope = (0, 61.93)
20.
The linear regression equation is y = 61.93x - 1.79.  According to the model, the slope can be interpreted as:
a)
After 0 hours of driving, they went 61.93 miles.
b)
They drove at a speed of 61.93 miles per hour.
c)
They drove 61.93 miles total.
d)
They drove 61.93 hours total.
21.
Which of the following could be a possible line of best fit for the data?
a)
y = -5/2x + 20
b)
y = -x + 19
c)
y = x + 20
d)
y = 2/3x + 15 
22.
You are analyzing a scatter plot that has a negative correlation. What is true of the of the x and y values?
a)
As x increases, y decreases
b)
As x increases, y increases
c)
As x decreases, y decreases
23.
What type of correlation (association)?
The outside temperature and the amount of layers you wear. 
a)
Positive correlation
b)
Negative correlation
c)
No correlation
24.
The table shown is comparing a person's foot length to their height in cm. Calculate a line of best fit.
a)
f(x) = 25.05x + 5.57
b)
f(x) = 5.57x + 25.05
c)
f(x) = -5.57x + 25.05
d)
f(x) = 5.57x - 25.05
25.
The range of a function is ______________________
a)
the domain
b)
the x-values
c)
the maximum minus the minimum
d)
the y-values
26.
The x-values of a function can also be called...
a)
the dependent values
b)
the algebra numbers
c)
the domain
d)
the range
27.
The table shown is comparing a person's foot length to their height in cm. What is the relationship between foot length and height?
a)
strong; r = .99
b)
strong; r = .97
c)
weak; r = .38
d)
weak; r = .58
28.
What kind of trend is shown from this scatter plot?
a)
positive correlation
b)
negative correlation
c)
none
d)
cannot be determind
29.
The equation of the least squares regression line is y (hat) = 1.3 + 0.73x.  What is the residual for the point (4,7)?
a)
2.78
b)
3.00
c)
4.00
d)
4.22
30.
The table represents a used car salesman's monthly salary including commission made on the sale of cars.  What is the slope and what does it represent?
a)
The slope is $850/car and it represents the commission per car sold.
b)
The slope is $425/car and it represents the commission per car sold.
c)
The slope is $1500 and it represents the monthly salary before commission.
d)
The slope is $850 and it represents the monthly salary before commission.