NEW
Font size
 Worksheets
Data Analysis Test Review
Total questions: 30
Worksheet time: 59mins
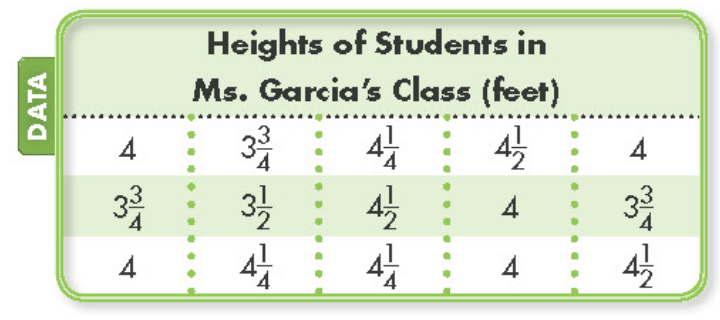
Which is the most common height in this class?
4
3 3/4
4 1/4
4 1/2
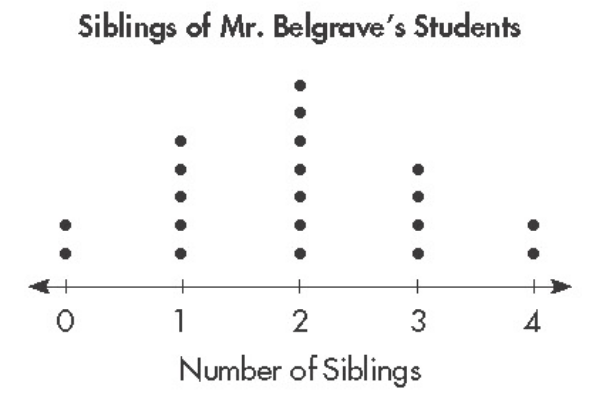
What number of siblings is most common in this class?
0
1
2
3
4
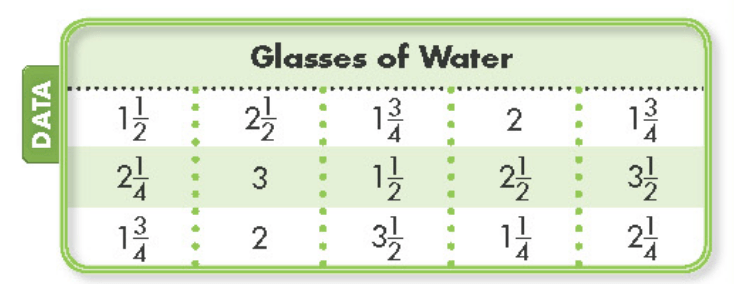
If a dot plot were used to represent this data, how many dots would be placed above 1 3/4?
3 dots
2 dots
1 dot
0 dots
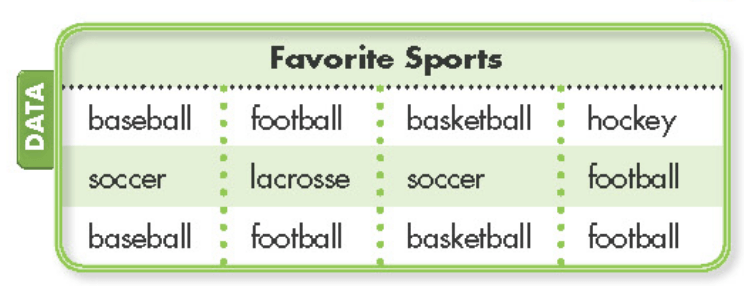
If a frequency table were used to represent the data, how many tally marks would there be for football?
1
3
4
5
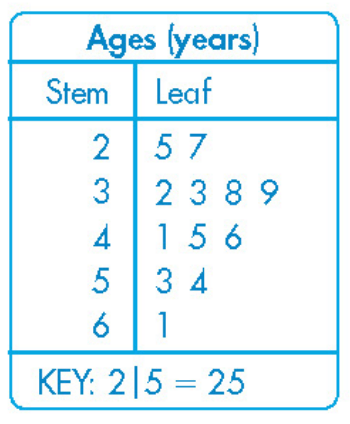
The members of a soccer club represent a wide range of ages. Using the stem and leaf plot, how many members are in the soccer club?
4
5
8
12
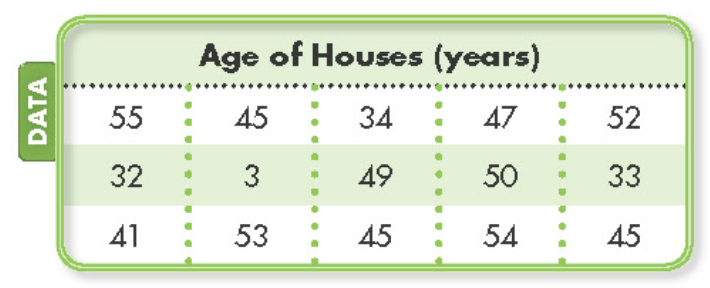
Which age is an outlier?
55
50
32
3
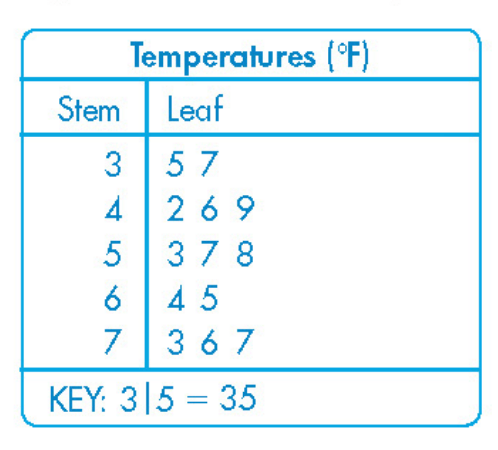
What is the difference between the highest and lowest temperatures?
40
42
35
77
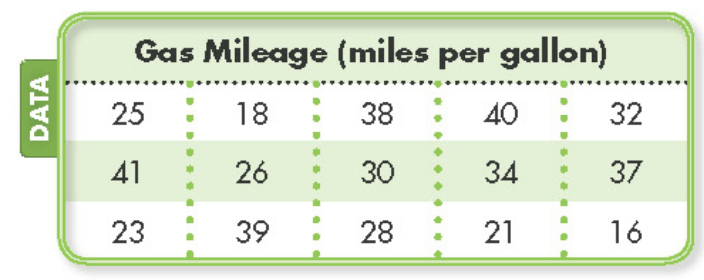
If this data were placed in a stem and leaf plot, which stem would NOT appear in the plot?
2
3
4
5
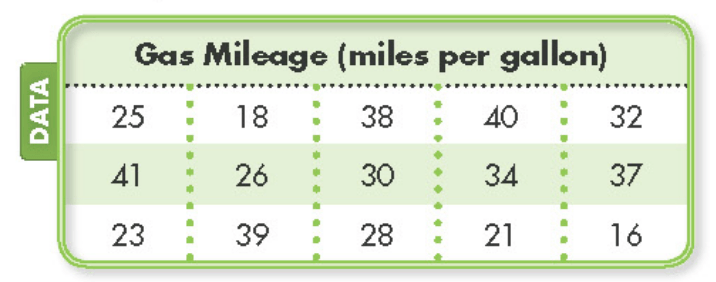
How many leaves would the stem of 3 have?
3
4
5
6
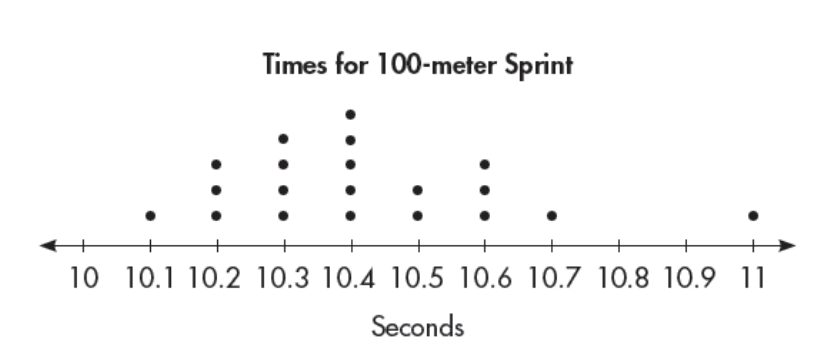
What statement about the dot plot is true?
More than half the people ran 100 meters in less than 10.4 seconds.
More than half the people ran 100 meters in 10.4 or 10.5 seconds.
Fewer than half the people ran 100 meters in more than 10.3 seconds.
Fewer than half the people ran 100 meters in more than 10.4 seconds.
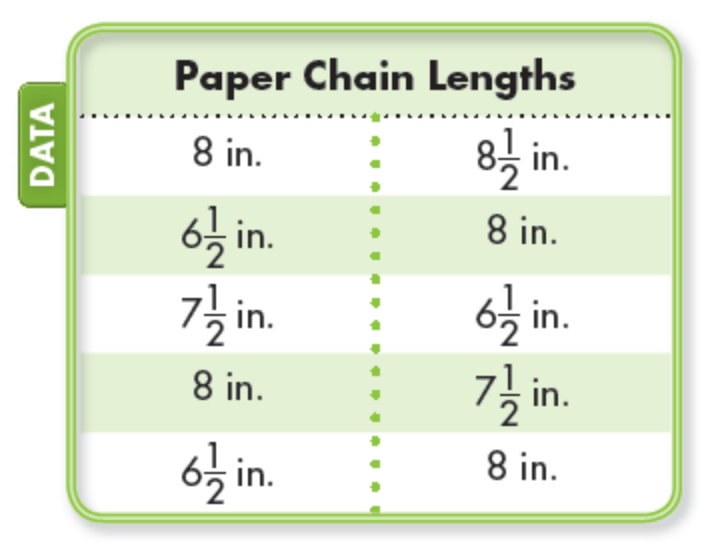
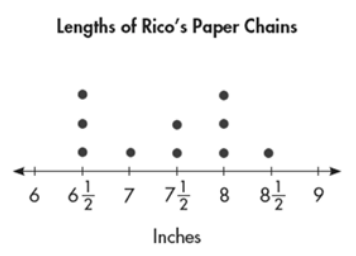
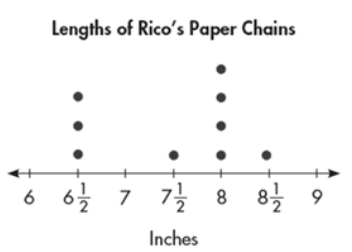
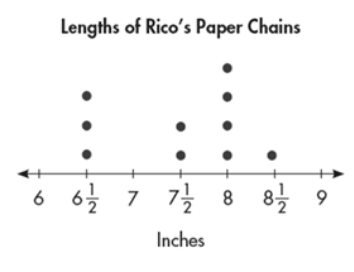
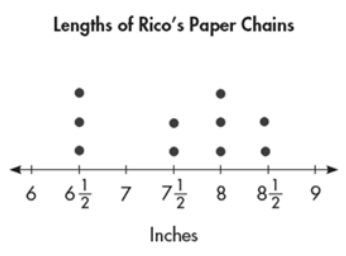
Rico wants to organize his collection of paper chains by making a dot plot. Which dot plot correctly represents the data in the chart below?
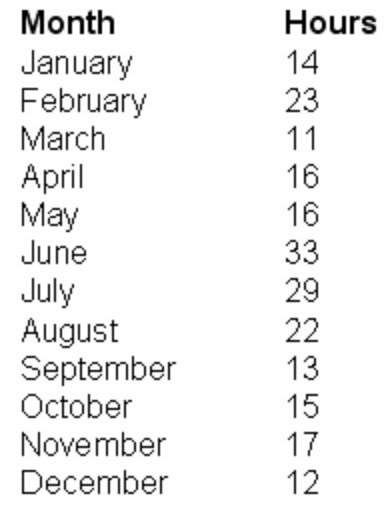
Antonio made the following chart for the number of hours he volunteered each month over the course of one year. Which stem-and-leaf plot represents his data?
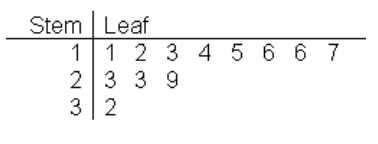
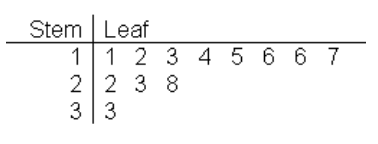
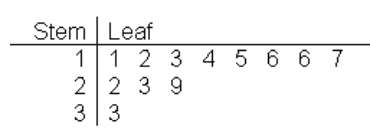
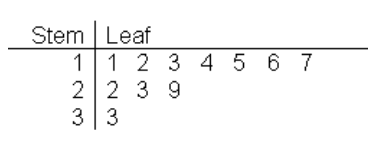
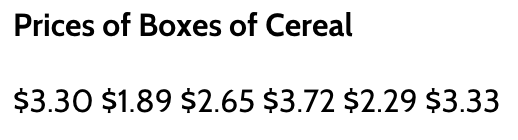
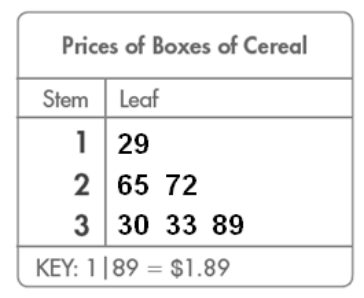
Which stem-and-leaf plot correctly represents the prices? Use 2-digit leaves to represent cents.
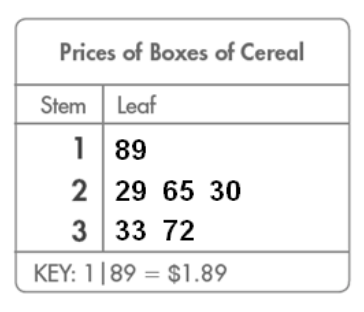
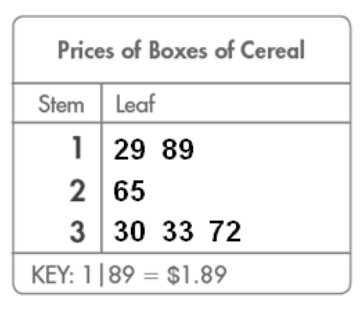
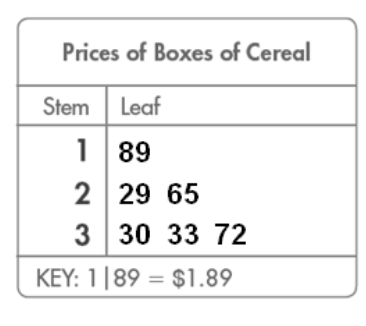
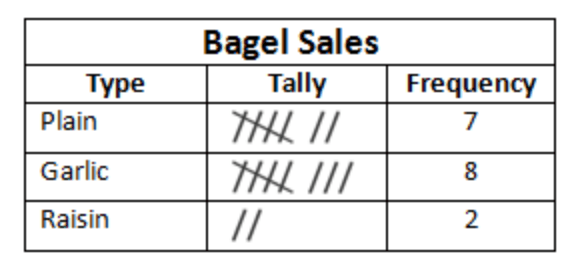
Bob's Bakery sells bagels for breakfast. What is the difference between the number of the most popular and least popular bagels they sell?
5
6
4
3
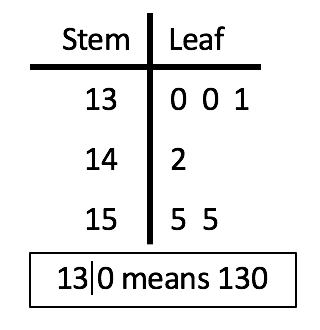
Henry recorded the number of minutes he practiced basketball. Based on the data, what is the amount of time in minutes Henry practiced basketball that started with a stem of a 15?
310
155
300
400
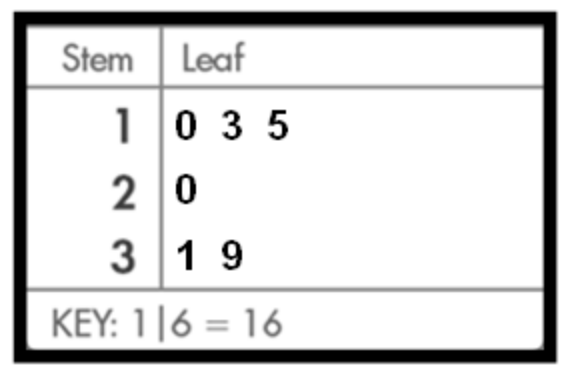
Sally made the stem-and-leaf plot below to represent a list of numbers. What was the list of numbers?
10 13 15 20 30 39
10 13 15 20 31 39
10 20 23 25 31 39
10 20 30 33 35 39
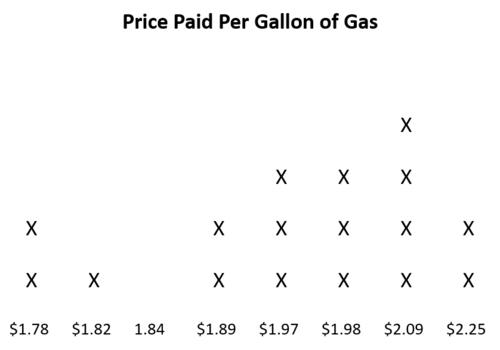
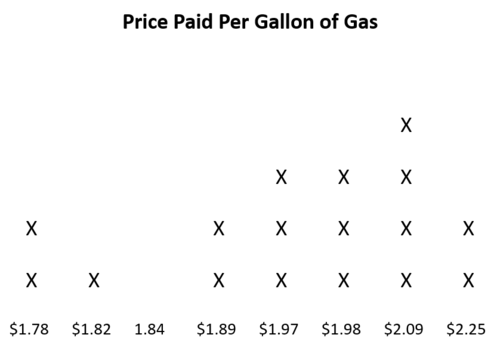
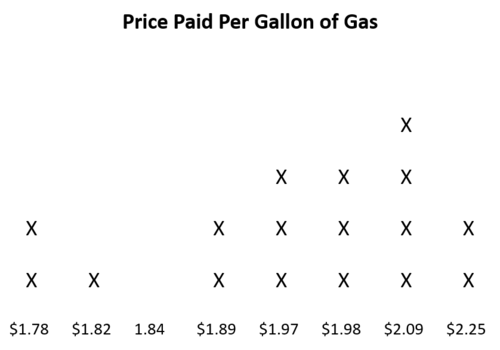
Using the information on the dot plot. How many people more people paid $2.09 or more per gallon of gas than paid $1.89 and $1.97 combined?
7
2
5
1
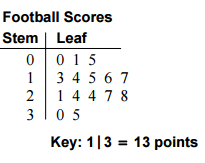
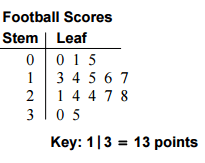

32, 38, 40, 44, 44, 46, 49, 53, 55, 58, 62, 65, 68, 70, 72, 81
He put the data in a stem-and-leaf plot. What number did he leave out of the stem-and-leaf plot?
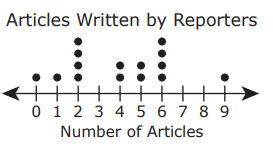
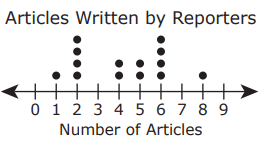
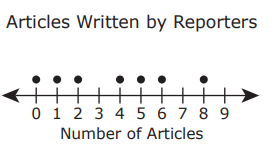
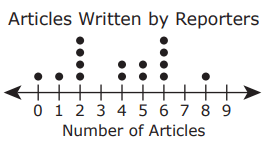
The list shows the number of articles written by different reporters at a newspaper last month.
6, 2, 5, 2, 6, 0, 4, 6, 1, 8, 5, 2, 6, 4, 2
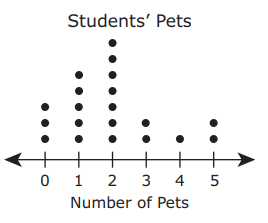
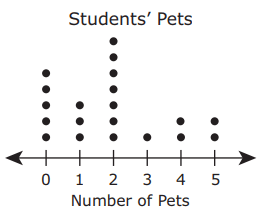
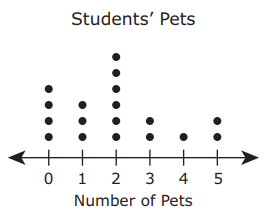
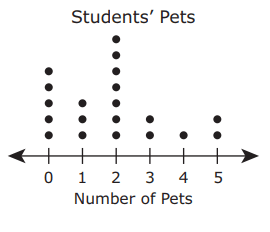
Which dot plot displays the same data?
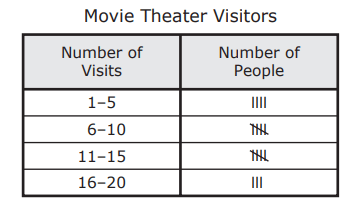
Which set of data could the frequency table represent?
1, 2, 2, 3, 6, 7, 7, 9, 12, 12, 12, 14, 17, 18, 20
1, 2, 2, 3, 6, 7, 7, 9, 12, 12, 12, 14, 17, 18, 20
1, 5, 6, 10, 11, 15, 16, 20, 4, 5, 5, 3
2, 2, 4, 5, 6, 6, 7, 8, 9, 11, 11, 13, 14, 15, 20, 20, 20
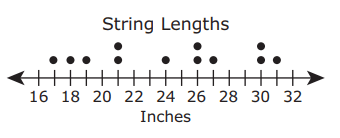
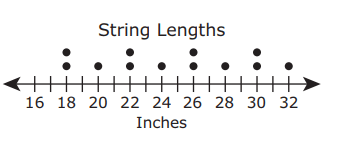
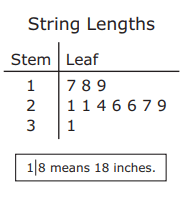
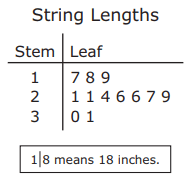
The list shows the lengths of twelve strings in inches.
26, 30, 19, 21, 24, 26, 18, 31, 27, 21, 17, 29
Which plot represents the data in the list?
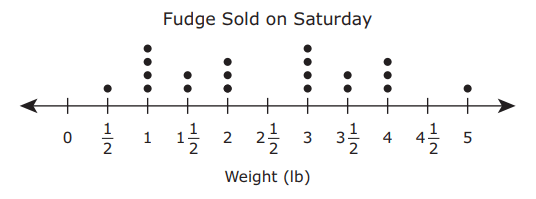
Which frequency table represents the same data shown on the dot plot?
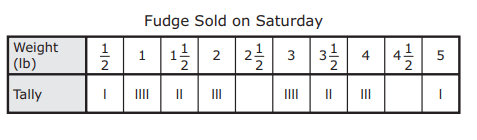
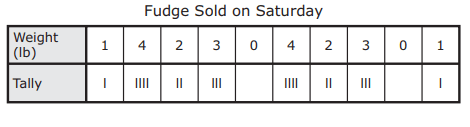
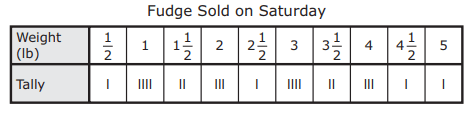
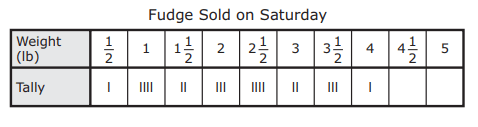
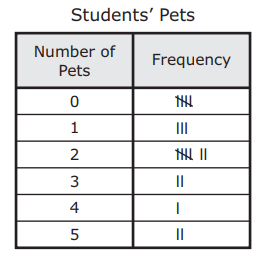
Which dot plot represents the data in the table?