wayground logo

Free Printable Worksheets

Font size

S
M
L
XL
Worksheets

Unit 10

Total questions: 92

Worksheet time: 3hrs 36mins

Name
Class
Date
1.
What is the mode?
a)
Number that occurs the most
b)
The Average
c)
The difference between the highest and lowest values
d)
The Number in the middle
2.
What is the mean?
a)
The number that occurs the most
b)
The number in the middle
c)
The difference between the highest and lowest values
d)
The Average
3.
What is the median?
a)
The number in the middle
b)
The difference between the highest and lowest values
c)
The number that occurs the most
d)
The average
4.
When finding the median what is the FIRST step?
a)
Mark off the lowest number
b)
Mark off the highest number
c)
Find the Middle
d)
Arrange the number from Least to Greatest
5.
At Donald's Donuts the number of donut holes in a bag can vary. Help Donald find the mode.
12,10,10,10,13,12,11,13,10
a)
13
b)
12
c)
11
d)
10
6.
Find the mean of these numbers:
2, 57, 38, 42, 6
a)
29
b)
38
c)
50
d)
145
7.
Use the table to find the mean
a)
105
b)
111
c)
118
d)
130
8.
Find the Median of the data set
a)
77
b)
99
c)
80
d)
78.5
9.
Find the mean:
28, 18, 19, 18, 17
a)
20
b)
18
c)
11
d)
19
10.
Find the median:
5, 6, 3, 9, 0, 4, 1, 2, 7
a)
4
b)
4.1
c)
5
d)
4.5
11.
When finding the median, what do you do if there are two middle numbers?
a)
Add them together and divide by 2
b)
Write them both as the answer
c)
Give up
d)
Pick one
12.
Find the median:
3, 5, 7, 4, 3, 1
a)
3 and 4
b)
There isn't one
c)
3.5
d)
3
13.
Find the mean:
3.8, 4.2, 4.0, 4.2, 4.2
a)
4.08
b)
20.4
c)
5.1
d)
4.2
14.
Find the median:
3.8, 4.2, 4.0, 4.2, 4.2
a)
4.2
b)
3.8
c)
4.0
15.
Find the mode:
3.8, 4.2, 4.0, 4.2, 4.2
a)
4.2
b)
3.8
c)
4.0
16.
Find the mean.
a)
8
b)
10
c)
7
d)
9
17.
Find median
a)
15
b)
8
c)
26
d)
12.5
18.
Which class has the higher test score median? 
a)
Class #1
b)
Class # 2 
c)
The medians are equal
d)
The median is not shown here. 
20.
Which is the correct data set for the dot plot?
a)
1, 2, 3, 4, 5, 6, 7, 8, 9, 
b)
1, 2, 2, 3, 3, 3, 4, 4, 4, 4, 5, 5, 5, 7, 9
c)
1, 2, 3, 4, 5, 7, 9
20.
Which is the correct data set for the dot plot?
a)
1, 2, 3, 4, 5, 6, 7, 8, 9, 
b)
1, 2, 2, 3, 3, 3, 4, 4, 4, 4, 5, 5, 5, 7, 9
c)
1, 2, 3, 4, 5, 7, 9
21.

What is the range?

a)

6

b)

2 - 8

c)

3

d)

4

22.

What is the first quartile?

a)

4

b)

5

c)

6

d)

7

23.

What is the third quartile?

a)

4

b)

5

c)

6

d)

7

24.

What is the interquartile range?

a)

3

b)

6

c)

4

d)

5

25.

What is the range?

a)

27

b)

12

c)

25

d)

13 - 40

26.

What is the first quartile?

a)

20

b)

26

c)

32

d)

13

27.

What is the third quartile?

a)

32

b)

26

c)

20

d)

31

28.

What is the interquartile range?

a)

12

b)

27

c)

15

d)

18

29.

What is the range?

a)

60

b)

22.5

c)

67

d)

35

30.

What is the first quartile?

a)

48.5

b)

67

c)

45

d)

52

31.

What is the third quartile?

a)

71

b)

70

c)

72

d)

67

32.

What is the interquartile range?

a)

22.5

b)

35

c)

60

d)

50

33.

What is the range?

a)

10

b)

12

c)

15

d)

2 - 12

34.

What is the first quartile?

a)

3

b)

4

c)

2

d)

6

35.

What is the third quartile?

a)

7

b)

6

c)

8

d)

3

36.
What is the Inter-quartile range of the Car Hops?
a)
4
b)
6
c)
13
d)
9
37.
In order to find the median, the data must be sorted from least to greatest first.
a)
True
b)
False
38.
What data value is the upper quartile?
a)
64
b)
62
c)
66
d)
58
39.

What is the interquartile range (IQR)?

a)

64

b)

4

c)

8

d)

60

40.

Find the IQR (Q3 - Q1)  of the data

20, 22, 25, 29, 31

a)
30
b)
21
c)
25
d)
9
41.
What is the total number of students speaking different languages?
a)
20
b)
25
c)
50
d)
100
42.
What is the relative frequency of students speaking Spanish?
a)
16%
b)
12%
c)
24%
d)
48%
43.
Which percent bar graph best represents the data from your table?
a)
a
b)
b
c)
c
d)
d
44.
What is the total number of animals at the refuge?
a)
20
b)
25
c)
50
d)
100
45.
What is the relative frequency of cheetahs at the refuge?
a)
25%
b)
20%
c)
16%
d)
100%
46.

What is the minimum? 6, 9, 4, 6, 8, 5, 2

a)

2

b)

4

c)

6

d)

9

47.

What is the maximum? 6, 9, 4, 6, 8, 5, 2

a)

2

b)

8

c)

6

d)

9

48.
What is the minimum value?
a)
64
b)
58
c)
66
d)
60
49.
What is the maximum value?
a)
58
b)
66
c)
64
d)
60
50.
What data value is the upper quartile (Q3)?
a)
64
b)
62
c)
66
d)
58
51.
What value is the lower quartile?
a)
66
b)
58
c)
60
d)
64
52.
Where is the gap?
a)
Between 0 and 5
b)
Between 6 and 7 students
c)
Between 8 and 12 
d)
13 students
53.

What % of class got a B?

a)

10%

b)

20%

c)

25%

d)

50%

54.
What percent of people chose gummy bears as their favorite candy? 
a)
25%
b)
15%
c)
30%
d)
None of these
55.

If you had the numbers-9,4,6,2,0,4,7,7,2,9,4,0,2,6,4,0,3,5,5. What would be the IQR?

a)

4.5

b)

3.5

c)

4

d)

6

56.

Find the median, first quartile, third quartile, and interquartile range of the data.

32, 53, 72, 66, 47, 54, 49, 67, 71

a)

Median: 54

First Quartile: 49

Third Quartile: 67

IQR: 18

b)

Median: 54

First Quartile: 48

Third Quartile: 69

IQR: 21

c)

Median: 54

First Quartile: 48

Third Quartile: 69

IQR: 22

d)

Median: 54

First Quartile: 49

Third Quartile: 69

IQR: 20

57.

Find the median, first quartile, third quartile, range, mode, and mean of the data.

32, 53, 72, 66, 47, 54, 49, 67, 71, 72

a)

Median: 54

First Quartile: 49

Third Quartile: 67

IQR: 18

Range: 43

Mode: 38

Mean: 63.8

b)

Median: 54

First Quartile: 48

Third Quartile: 69

IQR: 21

Range: 40

Mode: 72

Mean: 58.3

c)

Median: 54

First Quartile: 48

Third Quartile: 69

IQR: 19

Range: 63

Mode: 47

Mean: 36.7

d)

Median: 54

First Quartile: 49

Third Quartile: 69

IQR: 11

Range: 40

Mode: 47

Mean: 58.3

58.
What is the highest score in the class?
a)
88%
b)
100%
c)
13
d)
98%
59.
How many students scored 93% or less?
a)
6
b)
16
c)
14
d)
13
60.

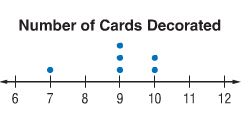
how many people voted in this dot plot

a)

4

b)

9

c)

3

d)

not here

61.
How many students received a score of 94%? 
a)
94
b)
4
c)
1
d)
2
62.
How many students received a score in the 80's?
a)
2
b)
10
c)
14
d)
27
63.
How many students received a score in the 80's?
a)
2
b)
10
c)
14
d)
27
64.
How many total students are in the science class?
a)
13
b)
6
c)
27
d)
25
65.
What is the range of the test scores?
a)
15
b)
100
c)
6
d)
10
66.
What is the MODE of this data?
a)
90
b)
85, 90, and 95
c)
85 and 95
d)
None
67.
What is the MEDIAN of this data?
a)
65
b)
40
c)
915
d)
13
68.
What is the MEAN for this data?
a)
80
b)
1040
c)
13
d)
81
69.
What is the minimum in this data set?
a)
0
b)
4
c)
9
d)
40
70.
How many scores are listed in this Stem and Leaf Plot?
a)
3
b)
6
c)
9
d)
18
71.
What is the highest quiz grade in the stem and leaf plot?
a)
9
b)
26
c)
92
d)
96
72.
How many baseballs were thrown 50 or more feet?
a)
5
b)
4
c)
13
d)
8
73.
How many baseballs were thrown 50 or more feet?
a)
5
b)
4
c)
13
d)
8
74.
A florist records the amount of money he spent on gasoline each week to deliver orders. The list shows the data for 16 weeks.
 32, 38, 40, 44, 44, 46, 49, 53, 55, 58, 62, 65, 68, 70, 72, 81
 He put the data in a stem-and-leaf plot. What number did he leave out of the stem-and-leaf plot?
   

a)
32
b)
44
c)
65
d)
81
75.
What is the range of the data shown in the stem and leaf plot?
a)
40
b)
56
c)
136
d)
96
76.
What is the median of the Stem-and-Leaf Plot?
a)
43.5
b)
42
c)
45
d)
44.5
77.
How many bags of candy had between 30 and 40 orange candies?
a)
6
b)
10
c)
7
d)
8
78.
What type of graph is this?
a)
Bar Graph
b)
Histogram
c)
Line Plot
79.
How many people watched more than 6 hours of TV?
a)
10
b)
5
c)
20
d)
17
80.
More people had between __ and __ cups of coffee than any other range.
a)
0-3
b)
8-11
c)
12-15
d)
16-19
81.
Which interval has 400 employees?
a)
33-43
b)
0-10
c)
77-87
d)
66-76
82.
Which interval has the greatest number of employees?
a)
11-21
b)
33-43
c)
77-87
d)
44-54
83.
How many employees have a salary less than $22,000?
a)
50
b)
350
c)
0
d)
10
84.
How many students scored between a 86 and a 90?
a)
1
b)
3
c)
6
d)
10
85.
How many students are between 48 and 51 inches tall?
a)
14
b)
8
c)
2
d)
0
86.

Which interval has the greatest number of students?
a)
48-51
b)
56-59
c)
60-63
d)
64-67
87.
How many students are between 60 and 63 inches tall?
a)
3
b)
0
c)
12
d)
7
88.
How many people watched between 6 and 10 hours of TV last week?
a)
31
b)
22
c)
15
d)
35
89.
How many people watched between 6 and 10 hours of TV last week?
a)
31
b)
22
c)
15
d)
35
90.
How many people watched less than 11 hours of TV last week?
a)
48
b)
90
c)
20
d)
65
91.
How many people watched more than 25 hours of TV last week?
a)
0
b)
10
c)
38
d)
42
92.
Is this an example of a histogram?
a)
yes
b)
no