
 Worksheets
Frequency Tree Diagrams & 2-Way Tables (DCoT)
Total questions: 11
Worksheet time: 9mins
Name
Class
Date
1.

How many people purchased no food and no drink?
a)
60
b)
10
c)
20
d)
200
2.

What color car is the least popular at this car dealership?
a)
Red
b)
White
c)
Blue
d)
Green
3.

How many sophomores like burritos and pizza?
a)
6
b)
5
c)
11
d)
50
4.

What percentage of males drive sports cars?
a)
35%
b)
16.25%
c)
65%
d)
25%
5.

What percentage of the students were boys?
a)
20%
b)
25%
c)
40%
d)
50%
6.

What percentage of the days that it rained, did they forecast no rain?
a)
About 20%
b)
About 18%
c)
About 14%
d)
About 12%
7.

According to the table, what is the relative frequency of students ages 10 - 13 who eat breakfast?
a)
About 33%
b)
About 50%
c)
About 40%
d)
About 44%
8.

How many total people were surveyed about what ice cream flavor they would pick?
a)
107
b)
92
c)
70
d)
269
9.

How many senior boys play football but do not wrestle?
a)
9
b)
12
c)
18
d)
104
10.
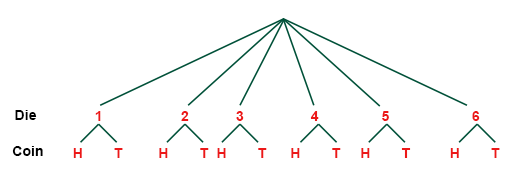
The tree diagram shows the outcomes of rolling a die and flipping a coin.
How many total outcomes are there?
How many total outcomes are there?
a)
6
b)
12
c)
24
d)
36
11.

Use the Tree Diagram. How many boys went to the river?
a)
47
b)
27
c)
41
d)
22
100 %

