
 Worksheets
Data Test - Plate Tectonics and Earthquakes
Total questions: 36
Worksheet time: 38mins

What is the name of layer Y?
lithosphere
mantle
crust
mesosphere
Which best explains the movement of tectonic plates?
They move several miles each year because of convection within Earth.
They move several centimeters each year because of convection within Earth.
They move several feet each year because of convection within Earth.
They move several kilometers each year because of convection within Earth.

Lithospheric plates have moved to form land formations on Earth’s surface. Which land formation occurs as a result of the plates folding upon one another?
a river
a volcano
an earthquake
a mountain range
Which event most likely takes place as the result of crustal movement along transform boundaries?
earthquakes
volcanic activity
mountain building
trenches


When 2 plates slip past each other, it happens at this plate boundary.
Convergent
Divergent
Transform

Most earthquakes in the world occur in the region shown in red. This is called the .....
Pacific Ring
Ring of Fire
Pacific Earthquake Zone
Mid-Oceanic Ridge

Why don't any s-waves travel through Earth's core?
the outer core is metallic, and s-waves can't travel through metals
the outer core is liquid, and s-waves can't travel through liquids
the outer core is solid, and s-waves can't travel through solids
the outer core is super hot, and s-wave can't travel through hot materials
The point on the surface directly above the point at which the earthquake occurs.
Focus
Epicenter
Seismic waves
Surface waves
What order to the 3 types of seismic waves arrive at a seismometer?
surface waves, P waves, S waves
P waves, surface waves, S waves
P waves, S waves, surface waves
S waves, P waves, surface waves

The arrival time for the S wave for Charlotte is:
8 min 8 sec
8 min 8.5 sec
8 min 14 sec
8 min 16 sec

The arrival time for the S wave for Honolulu is
8 min 9 sec
8 min 9.5 sec
8 min 15 sec
8 min 15.3 sec

The P - S wave time difference for Charlotte is:
8 min 9 sec
5 sec
8 min 14 sec
5.5 sec
The P - S wave time difference for Honolulu is:
8 min 9.5 sec
5 sec
8 min 15 sec
5.6 sec
If the P wave arrives at 11:58:12 am and the S wave arrives at 12:02:07pm, calculate the P - S wave time difference.
2 min 12 sec
3 min 0 sec
3 min 55 sec
4 min 07 sec

Determine the arrival time for the P - wave.
11h 40m 00s
11h 40m 20s
11h 40m 40s
11h 41m 00s
The point beneath Earth's surface where rocks break and trigger an earthquake.
epicenter
seismic waves
focus
magnitude
Determine the arrival time for the S - wave.
11h 47m 00s
11h 47m 40s
11h 48m 00s
11h 48m 20s
Determine the P - S arrival time difference.
11h 41m 00s
11h 40m 00s
0h 6m 00s
0h 07m 00s
Calculate the number of seconds in 2 min 18 sec.
120 sec
138 sec
152 sec
218 sec

A seismograph shows a P - S wave time difference of 35 sec. How far away was the epicentre.
300 km
340 km
350 km
400 km
A seismograph shows a P - S wave time difference of 64 sec. How far away was the epicentre.
600 km
620 km
640 km
650 km
A seismograph shows an epicentre is 680 km away. Determine the P - S wave time difference.
70 sec
60 sec
50 sec
40 sec

How wide is Australia from its west-most point to its east-most point. (Use a bit of paper placed against the screen.)
2000 km
3000 km
4000 km
5000 km
How far is it from Darwin to Sydney. (Use a bit of paper placed against the screen.)
2600 km
2800 km
3000 km
3200 km

Determine the distance from the seismograph station to the earthquake epicentre. (Place some paper against the screen.)
7,800 km
3,900 km
3,000km
2,500km

Estimate the approximate distance from the epicentre to Apia.
225 km
200 km
175 km
150 km

Which shape best marks the location of the epicentre for this earthquake.
Open triangle
Open diamond
Open circle
Closed triangle

Give the horizontal and vertical coordinates of the epicentre shown in this diagram.
-300, -500
400, -200
500, 100
600, 400

Determine the horizontal and vertical coordinates of the epicentre shown in the diagram.
0, 300
200, 100
300, 0
400, 400

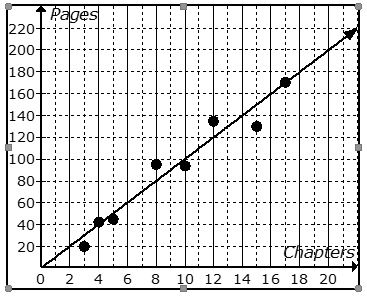
The scatter plot shows the relationship between the number of chapters and the total number of pages for several books. Use the trend line to predict how many pages would be in a book with 6 chapters.
100 pages
170 pages
60 pages
20 pages

