
NEW
Font size
 Worksheets
Guess the Correlation and Association
Total questions: 50
Worksheet time: 46mins



Estimate the correlation coefficient for this scatterplot.
A) r = 1.2
B) r = 0.89
C)r = 0
D) r = -0.89

Describe the correlation in the graph shown.
A) Strong Negative
B) Strong Positive
C) Weak Negative
D) No Correlation

Estimate the correlation coefficient for this scatterplot.
A) r = -0.9
B) r = 1
C) r = 0.9
D) r = -1

Describe the relationship between the variables.
A) Weak positive correlation
B) Weak negative correlation
C) Strong positive correlation
D) Strong negative correlation
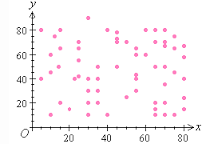
What type of correlation does this graph show?
A) Positive
B) negative
C) none
D) all of the above
As x increases, y decreases.
A) no correlation
B) negative correlation
C) correlation coefficient
D) positive correlation
As x increases, y increases
A) correlation coefficient
B) causation
C) positive correlation
D) negative correlation

The scatter plot below shows the number of books read by students in Mrs. Hall’s English class and their final grades. Which statement represents the best description about the line of best fit?
A) The more books students read, the lower their English grade.
B) The more books students read, the higher their English grade.
C) The fewer books students read, the higher their English grade.
D) No relationship exists between the number of books students read and their English grades.

What type of correlation does this graph have?
Positive correlation
Negative correlation
No correlation
Constant correlation

What type of correlation does this scatter plot show?
Positive correlation
Negative correlation
No correlation
Constant correlation

What type of relationship does this scatter plot represent?
Positive
Negative
No Relationship
Constant

Based on the scatterplot, which of the following conclusions about the relationship between her height and weight is true?
There is a negative relationship between height and weight
There is a positive relationship between height and weight
There is a constant relationship between height and weight
There is no relationship between height and weight


Based on the scatter plot, which statement best describes the trend?
As the daily temperature increases, the number of beach visitors increases.
As the daily temperature decreases, the number of beach visitors increases.
As the daily temperature increases, there is no change in the number of beach visitors
As the daily temperature increases, the number of beach visitors decreases
The outside temperature and the amount of layers you wear.
The temperature outside and the amount of ice cream sales.
Describe the correlation, if the correlation coefficient is r = -0.26
Positive, weak
Negative, weak
Positive, strong
Negative, strong

Describe the correlation coefficient if
r = 0.90
Positive, weak
Positive, strong
Negative, weak
Negative, strong
Describe the correlation. r = 0.3
Strong, positive
Weak, positive
Strong, negative
Weak, negative
Describe the correlation:
r = -0.98
Strong positive
Weak positive
Strong negative
Weak negative

Estimate the correlation coefficient.
r is close to zero
r is close to -1
r is close to 1
r is close to -1.5
r is close to 1.5
Estimate the correlation coefficient.
r is close to 1
r is close to -1
r is close to 0
r is close to -0.5
r is close to 0.5
Estimate the correlation coefficient
r = 1
r = -1
r ≈ -0.8
r ≈ 0.8
r ≈ -0.5

Describe the association of the scatter plot
Linear; positive association
Linear; negative association
Non-linear; negative association
Non-linear; positive association
Hector surveyed 500 people and asked them how far they drive to work and what the last digit of their phone number is. He used the results to make a scatter plot.
What type of association should he expect to see in the scatter plot?
positive association
negative association
no association
Jules conducted a survey and asked 100 people how many years of education they have and what their annual income is. She used the results to make a scatter plot.
What type of association should he expect to see in the scatter plot?
positive association
negative association
no association

Label the type of association shown by the scatter plot as positive, negative or none.
positive
negative
none

Label the type of association shown by the scatter plot as positive, negative or none.
positive
negative
none
Which scatter plot(s) could be used to show the relationship between a person’s age and a person’s height?


Which scatter plot(s) could be used to show the relationship between a person’s age and the number of syllables in a person’s first and last name?

Which scatter plot has a stronger association? How do you know?
Scatter plot A; the points of data are closer together.
Scatter plot B; the points of data are not close together.
Which scatter plot appears to be linear?
Scatter plot A
Scatter plot B

