
 Worksheets
Rate of Change
Total questions: 15
Worksheet time: 2hrs 37mins
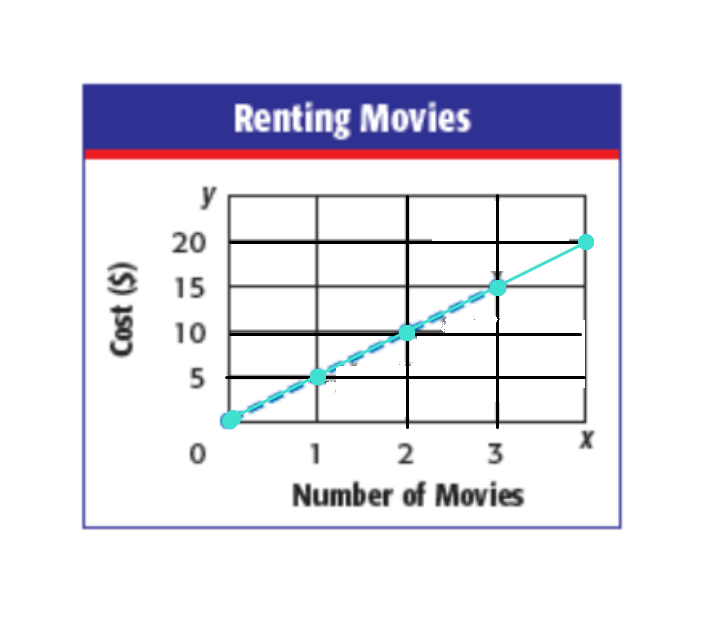
Which rate of change represents the following the graph shown?
$ 5 per movie
$10 per movie
$1 per movie
$0.20 per movie
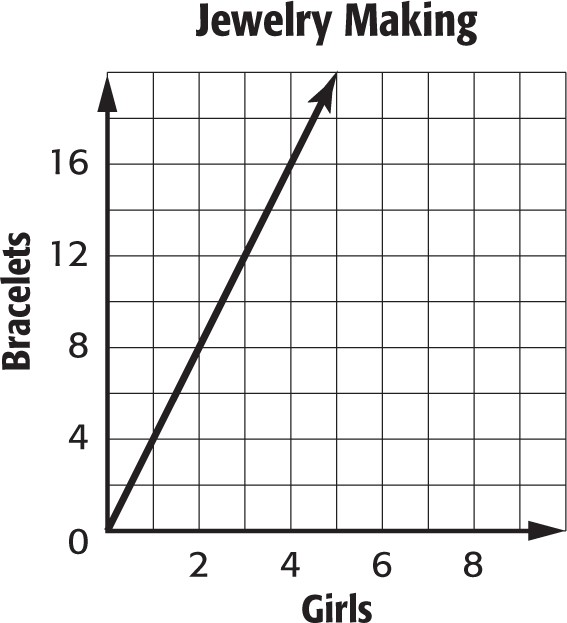
Which rate of change represents the following graph?
4 bracelets per girl
3 bracelets per girl
0.25 bracelets per girl
2 bracelets per girl
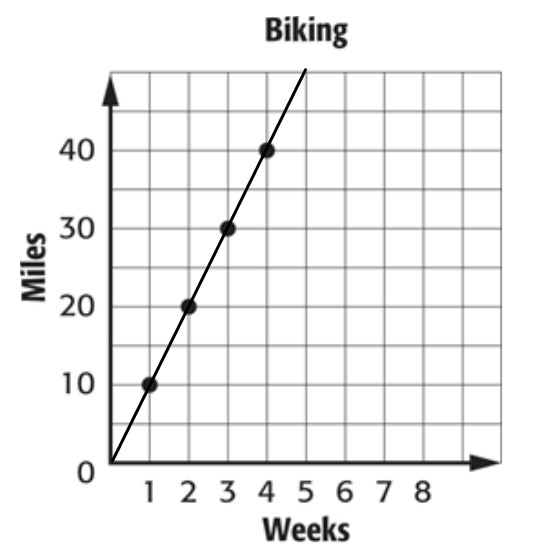
Which of the following rates represents the graph shown?
0.1 miles per week
9 miles per week
10 miles per week
5 miles per week
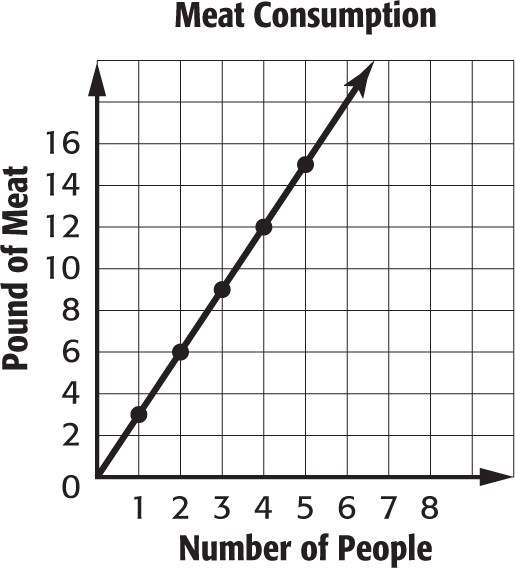
Which of the following rates of change represents the graph?
$2 per pound
$3 per pound
$0.50 per pound
$1 per pound
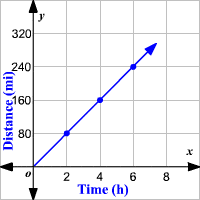
Which rate of change represents the graph shown?
80 mile per hour
2 hours per mile
40 miles per hour
60 miles per hour

Let x be the map distance in inches and y be the actual distance in miles. Find the rate of change.
20 inches per mile
1 mile per 20 inches
20 miles per inch
1 inch per 20 miles

Let x be the number of apple and y be the number of seeds. Find the rate of change.
10 seeds per apple
10 apples per seed
1 seed per 10 apples
1 apple per 10 seeds

Let x be the age in years and y be the height in inches. Find the rate of change.
2 inches per year
2 years per inches
1 inch every 2 years
1 year every 2 inches

What is the constant rate of change between the quantities in the table?
4 calories per minute
15 calories per minute
40 calories per minute
60 calories per minute

What is the constant rate of change between the quantities in the table?
$1 per hour
$40 per hour
$5 per hour
$10 per hour
A rocket is 1.5 miles above the Earth in 20 seconds and is 8 miles above the Earth in 2 minutes. What is the rocket's rate of change in miles per second?
0.065 mps
0.361 mps
3.892 mps
4.145 mps

