Wayground logo

Free Printable Worksheets

Font size

S
M
L
XL
Worksheets

Chapter 3 Functions and Relations Review

Total questions: 99

Worksheet time: 6hrs 29mins

Name
Class
Date
1.
What is the definition of function?
a)
Has inputs and outputs
b)
Every input has only ONE output
c)
Inputs have different outputs every time
d)
x-values and y-values
2.
Write the equation for the table given
a)
y = 1/3x
b)
y = 3x
c)
y = -1/3x
d)
y = -3x
3.
If my function rule is x + 3, what is the OUTPUT if the input is 4?
a)
4
b)
3
c)
7
d)
10
4.
What is the function of the table?
a)
y=x*2
b)
y=x+2
c)
y=x/2
d)
y=x-2
5.
What is the function of the table?
a)
y=x*6
b)
y=x+10
c)
y=x-10
d)
y=x÷6
6.
y=x-6
What is the missing number?
a)
12
b)
10
c)
14
d)
13
7.
A store receives 7 new movies per week. Write an equation to find the number of movies "y" the store receives after "x" weeks.
a)
y = 7x
b)
x = 7y
c)
x + 7 = y
8.
Jeff earns $10 per hours raking leaves. Write an equation to find the amount of money "y" he earns for "x" number of hours.
a)
y = 10x
b)
x = 10y
c)
y = x + 7
9.
Pablo has $12. He earns $7 for every lawn he mows. Write an equation to find the amount of money "y" he will have after "x" number of lawns.
a)
y = 12x + 7
b)
y = 7x + 12
10.
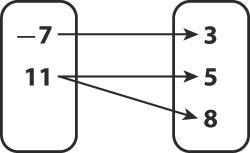
Is the relation a function? Why.
a)
Yes, because the x-value 11 has two y-values pair with it.
b)
Yes, because each x-value has only one y-value paired with it.
c)
No, because the x-value 11 has two y-values pair with it.
d)
No, because each x-value has only one y-value paired with it.
11.
a)
Function
b)
Not a Function
12.
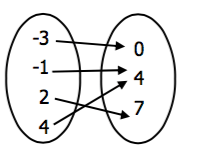
Is this mapping a function or not a function? 
a)
Function
b)
Not a Function 
13.
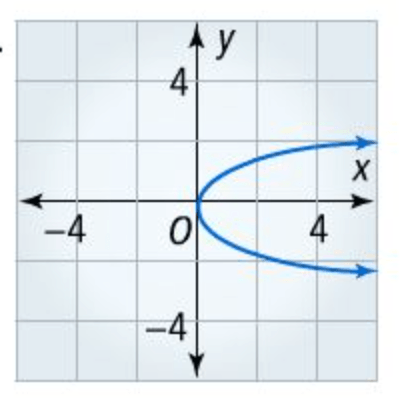
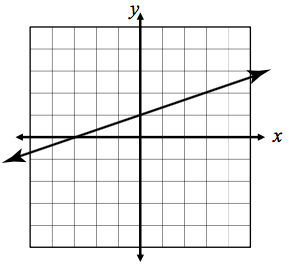
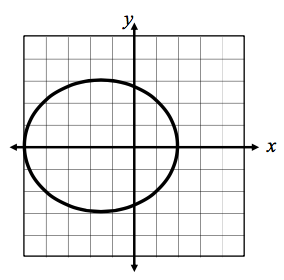
Is this graph a function or not a function? 
a)
Function
b)
Not a Function
14.
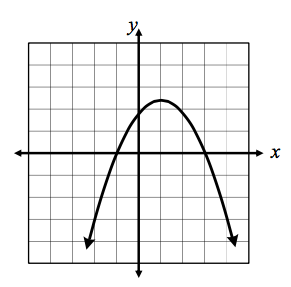
Is this graph a function or not a function? 
a)
Function
b)
Not a Function
15.
Is this graph a function or not a function? 
a)
Function 
b)
Not a Function 
16.
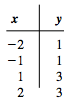
Does this relation represent a function?
(1,5), (1,6), (1,7), (1,8), (1,9)
a)
Yes
b)
No
17.
You can identify a function from a graph by using the.....
a)
Horizontal Line Test
b)
Eye Test
c)
Vertical Line Test
d)
Diagonal Line Test
18.
Does this table represent a function?
a)
Yes 
b)
No
19.
Is this graph a function or not a function? 
a)
Function
b)
Not a Function
20.
Which set of values is a function?
a)
(9,5) (10,5) (9,-5) (10,-5)
b)
(3,4) (4,-3) (7,4) (3, 8)
c)
(6,-5) (7, -3) (8, -1) (9, 1)
d)
(2, -2) (5, 9) (5, -7) (1, 4)
21.
Which graph does NOT pass the vertical line test?
a)
Graph 1
b)
Graph 2
c)
Graph 3
d)
Graph 4
22.
.
a)
Function
b)
Not a Function
23.
a)
Function
b)
Not a Function
24.
You can buy 36 cookies for $4. What is the unit rate (in cookies per dollar)?
a)
4 cookies per dollar
b)
6 cookies per dollar
c)
9 cookies per dollar
d)
1/9 dollars per cookie
25.
Is this set of ordered pairs a function or not a function? 
a)
Function
b)
Not a Function 
26.
The independent variable is the ONE thing you _____ to test your hypothesis.
a)
change
b)
keep the same
c)
experiment with
d)
investigate
27.
The variable that is measured throughout the experiment is the ________________
Hint: It may change as a result of your testing.
a)
Controlled Variable
b)
Responsive Variable
c)
Dependent Variable
d)
Independent Variable
28.
Catherine is testing which soil will help grass grow the tallest.  The height of the grown grass is the __ variable.
a)
constant (stays the same)
b)
independent (it's what you change)
c)
dependent (it's what you measure)
29.
What would the INDEPENDENT variable be in an experiment testing which  paper airplane design goes furthest?
a)
the paper used
b)
the paper airplane design
c)
the distance of each plane's flight
d)
how hard the plane is thrown
30.
When experimenting with plants to see if they grow better with or without fertilizer, a scientist uses six bean plants and one type of fertilizer. What type of variable is the fertilizer?
a)
Dependent
b)
Independent
c)
Control
d)
Compound
31.
An experiment is performed on plants to see how different liquids affect plant growth. Each plant in the experiment is given a different liquid; water, apple juice, or milk.  In this investigation, the independent variable is ...
a)
The type of plant
b)
The amount of sunlight
c)
The type of music
d)
The type of liquid
32.
Mrs. Ahlers set up an experiment to see how the mass of a ball affects the distance it rolls off a ramp. What is the dependent variable?
a)
Distance traveled by the ball
b)
Height of the ramp
c)
Mass of the ball
d)
Where the experiment took place.
33.
Jonathan set up the same experiment to see how the mass of a ball affects the distance it rolls off a ramp. Identify the independent variable.
a)
Distance traveled by the ball
b)
Height of the ramp
c)
Mass of the ball
d)
Who set up the experiment (Jonathan etc)
34.
Daniel was investigating how fast it took mice to react to different sounds. Identify the independent variable.
a)
How fast mice reacted
b)
different sounds
c)
types of music
d)
Daniel
35.
Students took a test after they had studied either in silence or with the television turned on. What is the dependent variable?
a)
silence
b)
television turned on
c)
score on test
d)
subject 
36.
For the function {(0,1), (1,-3), (2,-4), (-4,1)}, write the domain.
Remember:  Domain is x 
(x,y)
a)
D: {1, -3, -4,}
R: {0, 1, 2, -4}
b)
D:{0, 1, 2, -4}
R:{1, -3, -4}
c)
D:{0, 1, 2, 3, 4}
R:{1, -3, -4}
37.
What is the range of the graph?
Remember: Range is y! 
a)
1 ≤ x ≤ 5
b)
1 < x < 5
c)
1 ≤ y ≤ 5
d)
1 < y < 5
38.
What is the domain of the graph?
Remember:  Domain is x
a)
1≤ x ≤ 4
b)
1 < x < 4
c)
1≤ y ≤ 4
d)
1 < y < 4
39.
Does the graph represent a function?
If you have an x value that has 2 "y" values it is NOT a function! 
a)
Yes, because the vertical line test shows there are no repeating input values
b)
No, because the vertical line test shows there are repeating input values
40.
All of the y values or outputs are called what?
a)
Domain
b)
Range
41.
All of the x values or inputs are called what?
a)
Domain
b)
Range
42.
What is the range of the following relation:
(9, -2) (4, 3)  ( 8, 10) ( -4, 8)
Range is the y values 
(x,y)
a)
-4, 4, 8, 9
b)
-2, 3, 8, 10
c)
(9, -2) ( 4, 3)
d)
(8, 10) (-4, 8)
43.
Identify the domain of the following relation:
Remember domain is the "x" values
a)
-6, 14, 2, 28
b)
(-6,14), (0,32), (2,38), (4,44)
c)
-6, 0, 2, 4
d)
14, 32, 38, 44
44.
What is the domain of the graph?
Remember:   Domain is the "x" values from left to right
a)
-7 ≤ x < 5
b)
-3 ≤ x < 1
c)
-3 ≤ y < 1
d)
-7 ≤ y < 5
45.
What is the range of the graph?
Remember: Range is the "y" values (up and down) 
a)
-7 ≤ x < 5
b)
-3 ≤ x < 1
c)
-3 ≤ y < 1
d)
-7 ≤ y < 5
46.
a)
The cat has 2 eyes
b)
The cat has 2 kittens
c)
The cat has 4 paws
d)
The cat weights 5.4 kg
47.
What is the DOMAIN of this graph? 
Remember DOMAIN is "x" values that go left to right. 
a)
-4 ≤ x ≤ 3
b)
-1 ≤ x ≤ 4
c)
4 < x < 3
d)
-1 < x < 4
48.
What is the DOMAIN of this graph? 
Remember:  DOMAIN is the x from left to right. 
a)
x < -3
b)
x ≤ -3
c)
x > -3
d)
x ≥ -3
49.
IS THIS GRAPH DISCRETE AND CONTINUOUS?  
a)
DISCRETE
b)
CONTINUOUS
50.
IS THIS GRAPH DISCRETE AND CONTINUOUS? 
a)
CONTINUOUS
b)
DISCRETE
51.
g(x) = 3x + 1
g(2) = _______
a)
6
b)
7
c)
8
d)
9
52.
g(x) = 3x + 1
g(10) = ______
a)
14
b)
31
c)
15
d)
-31
53.
g(x) = 3x + 1
g(8) = ______
a)
25
b)
12
c)
6
d)
13
54.
g(x) = x + 1
g(8) = ______
a)
9
b)
8
c)
7
d)
6
55.
g(x) = x + 1
g(10) = ______
a)
8
b)
9
c)
10
d)
11
56.
g(x) = x + 1
g(2) = ______
a)
5
b)
4
c)
3
d)
2
57.
f(x) = x2 + 7
x(2) = ______
a)
10
b)
11
c)
13
d)
12
58.
j(x) = 2x + 3
j(-1) = ______
a)
1
b)
-1
c)
5
d)
-5
59.
j(x) = 2x + 3
j(-2) = ______
a)
-7
b)
1
c)
7
d)
-1
60.
b(x) = 2x - 3
b(-3) = ______
a)
-9
b)
3
c)
9
d)
-3
61.
The next two terms of the sequence 4,7,10,13 are
a)
16 and 19
b)
15 and 19
c)
16 and 18
d)
15 and 18
62.

The next two terms of the sequence 12,17,22... are

a)

28 and 33

b)

29 and 34

c)

27 and 32

d)

30 and 35

63.
Identify the common difference. 
10, 20, 30, 40, ...
a)
5
b)
10
c)
15
d)
20
64.
Identify the common difference.
3, 7, 11, 15, ...
a)
6
b)
5
c)
4
d)
2
65.
Identify the common difference.
97, 86, 75, 64, ...
a)
8
b)
11
c)
-11
d)
-8
66.
Find the 32nd term of this sequence.
9, 4, -1, -6, -11, ...
a)
81
b)
-34
c)
-146
d)
-225
67.
Find the 22nd term of the following sequence:
5, 8, 11, ...
a)
14
b)
68
c)
63
d)
71
68.
Is the sequence arithmetic: -3, 3, -3, 3, ...
a)
Yes
b)
No
69.
Is the sequence arithmetic: 37, 31, 25, 19, ...
a)
Yes
b)
No
70.
Is the sequence arithmetic: 17, 9, 1, -7, ...
a)
Yes
b)
No
71.
Find the common difference: -34, -29, -24, -19, ...
a)
d = -5
b)
d = 5
c)
d = -6
d)
d = 6
72.
Find the common difference: 29, 21, 13, 5, ...
a)
d = -10
b)
d = -9
c)
d = -8
d)
d = -7
73.
Find the common difference: -18, -23, -28, -33, ...
a)
d = -5
b)
d = 5
c)
d = -3
d)
d = 3
74.
Find the next three terms in the arithmetic sequence: -33, -24, -15, -6, ...
a)
-1, 7, 15
b)
-5, 2, 9
c)
3, 12, 21
d)
-65, -73, -81
75.
Find the next three terms in the arithmetic sequence: 9, 19, 29, 39, ...
a)
45, 54, 63
b)
49, 59, 69
c)
39, 49, 59
d)
59, 69, 79
76.
Find the next three terms in the arithmetic sequence: 25, 34, 43, 52, ...
a)
63, 72, 81
b)
79, 88, 97
c)
70, 79, 88
d)
61, 70, 79
77.
Find the 35th term in the arithmetic sequence: -10, -14, -18, -22, ...
a)
-216
b)
-148
c)
-146
d)
-150
78.
Find the 26th term in the arithmetic sequence: 20, 26, 32, 38, ...
a)
182
b)
176
c)
170
d)
-118
79.
Find a20 in the arithmetic sequence: 5, 12, 19, 26...
a)
145
b)
144
c)
142
d)
138
80.
Which sentence describes the relationship shown on this scatter plot?
a)
As the temperature decreases, the visitors increase. 
b)
As the temperature increases, the number of visitors increases. 
c)
As the visitors increase, the temperature decreases. 
d)
No correlation
81.
What type of association does this scatter plot represent?
a)
positive linear association
b)
negative linear association
c)
no association
d)
nonlinear association
82.
What type of association (correlation) does this graph have?
a)
positive 
b)
negative
c)
none
d)
all of the above
83.
What type of correlation does this graph have?
a)
positive
b)
negative
c)
none
d)
all of the above
84.

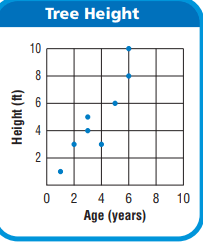
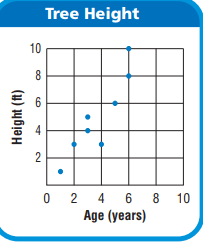
What is the age of the tree that is 8 feet tall?

a)

6 Years

b)

7 Years

c)

8 Years

d)

9 Years

85.

How many trees are 3 years old?

a)

1

b)

2

c)

0

d)

3

86.

If a squirrel climbs to the top of each tree that is 6 years old, how far has the squirrel climbed?

a)

2 ft

b)

18 ft

c)

10 ft

d)

11 ft

87.

JoBeth draws a scatter plot that shows as the outside temperature increases, sales at her lemonade stand increase. Which best describes the scatter plot?

a)

The points show that as x-values increase, y-values increase.

b)

The points show that as x-values increase, y-values decrease.

c)

The points show that as x-values decrease, y-values stay the same.

d)

The points show that as x-values decrease, y-values increase.

88.

Which relationship could be represented by this scatter plot?

a)

As the number of muffins in a box increases, the price increases.

b)

As the speed of a car increases, the distance the car travels increases.

c)

As the population of a city increases, the number of schools in the

city increases.

d)

As the number of daylight hours increases, the number of night hours decreases.

89.

What type of correlation does this graph have?

a)

Negative

b)

no association

c)

positive

90.

What type of correlation does this graph have?

a)

positive

b)

negative

c)

none

d)

all of the above

91.

Mrs. Collins made a scatterplot to show the relationship between the number of absences and a student’s final exam score. Based on this scatterplot, a student with 12 absences should get approximately what score on the final exam?

a)

60

b)

92

c)

70

d)

76

92.

Describe the correlation in the graph shown.

a)

Strong Negative

b)

Strong Positive

c)

Weak Negative

d)

Weak Positive

93.

What type of correlation does this scatter plot show?

a)

positive

b)

negative

c)

no correlation

d)

nonlinear association

94.

Mrs. Collins made a scatterplot to show the relationship between the number of absences and a student’s final exam score. Based on this scatterplot, a student with 6 absences should get approximately what score on the final exam?

a)

85

b)

92

c)

70

d)

76

95.

Mrs. Collins made a scatterplot to show the relationship between the number of absences and a student’s final exam score. Based on this scatterplot, a student with 6 absences should get approximately what score on the final exam?

a)

65

b)

92

c)

70

d)

76

96.

Describe the correlation in the graph shown.

a)

Strong Negative

b)

Strong Positive

c)

Weak Negative

d)

Weak Positive

97.
The following scatter plot shows Pam's training as she prepares to run a 6 mile race at the end of the month.  Which of the following would be a reasonable approximation for the length of time it would take for her to run 6 miles? 
a)
A. 50 min
b)
B. 80 min
c)
C. 45 min
d)
D. 60 min
98.

Which scatter plot show a positive relationship?

a)

Graph A

b)

Graph B

c)

Graph C

d)

Graph D

99.

Based on the scatterplot, which of the following conclusions about the relationship between her height and weight is true?

a)

There is a negative relationship between height and weight

b)

There is a positive relationship between height and weight

c)

There is a constant relationship between height and weight

d)

There is no relationship between height and weight