wayground logo

Free Printable Worksheets

Font size

S
M
L
XL
Worksheets

Distance Time Graph

Total questions: 55

Worksheet time: 1hrs 5mins

Name
Class
Date
1.
Which runner won the race?
a)
A
b)
B
c)
C
2.
Which runner had a head start?
a)
A
b)
B
c)
C
3.
What does this graph represent?
a)
Constant Speed
b)
Acceleration
c)
Not moving
4.
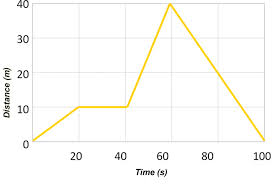
How long did it take this object to travel 10 m?
a)
0 s
b)
10 s
c)
15 s
d)
20 s
5.
At 60 seconds, how far had this object traveled? 
a)
0 m
b)
10 m
c)
20 m
d)
40 m
6.
What does this graph represent?
a)
Constant speed
b)
Acceleration
c)
Not moving
7.
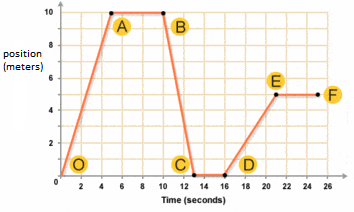
What is happening at D?
a)
Stationary
b)
Accelerating
c)
Fast steady speed; moving away from the starting position
d)
Slower steady speed; moving away from the starting position
8.
What is happening at C?
a)
Stationary
b)
Accelerating
c)
Fast steady speed; moving away from the starting position
d)
Slower steady speed; moving away from the starting position
9.

Segment O-A The bus is _________________.

a)

at rest

b)

returning (to original position)

c)

moving forward

10.

Segment A-B The bus is _________________.

a)

at rest

b)

returning (to original position)

c)

moving forward

11.

Segment B-C The bus is _________________.

a)

at rest

b)

returning (to original position)

c)

moving forward

12.

Segment C-D The bus is _________________.

a)

at rest

b)

returning (to original position)

c)

moving forward

13.

Segment D-E The bus is _________________.

a)

at rest

b)

returning (to original position)

c)

moving forward

14.

Segment E-F The bus is _________________.

a)

at rest

b)

returning (to original position)

c)

moving forward

15.

Which runner won the race?

a)

Albert

b)

Bob

c)

Charlie

16.

Which runner stopped for a rest?

a)

Albert

b)

Bob

c)

Charlie

17.

How long did Charlie stop for a rest?

a)

2.5 seconds

b)

2 seconds

c)

3 seconds

d)

5 seconds

18.

How long did Bob take to complete the race?

a)

17 seconds

b)

12 seconds

c)

14 seconds

d)

15 seconds

19.

Calculate Albert's average speed for the 100-meter race.

a)

8.33 m/s

b)

5 m/s

c)

7.14 m/s

d)

5.88 m/s

20.
How long did it take this object to travel 10 m?
a)
0 s
b)
10 s
c)
15 s
d)
20 s
21.
How long did it take this object to travel back to its reference/starting point?
a)
20 s
b)
30 s
c)
60 s
d)
100 s
22.
In a duck race, a rubber duck travelled 400 meters in 10 minutes? What was the rubber duck´s speed?
a)
40
b)
40 minutes
c)
40mm/s
d)
40m/s
23.
a)
b)
c)
d)
24.
a)
b)
c)
d)
25.
a)
b)
c)
d)
26.
a)
b)
c)
d)
27.
a)
b)
c)
d)
28.
Which runner stopped for a rest?
a)
Albert
b)
Bob
c)
Charlie
29.
Which runner won the race?
a)
Albert
b)
Bob
c)
Charlie
30.

What is happening at E?

a)

Stationary

b)

Accelerating

c)

Fast steady speed; moving away from the starting position

d)

deceleration

31.

What is happening at A?

a)

Stationary

b)

Accelerating

c)

Slower steady speed; moving away from the starting position

d)

steady speed

32.
What is the speed of a man who runs 10 miles in 1 hr?
a)
20 miles
b)
10 m/min
c)
10 miles/hr
d)
20 hrs
33.
What is the equation to calculate distance?
a)
distance = speed/time
b)
distance = time/speed
c)
distance = speed/distance
d)
distance = speed x time 
34.
A car travels 30 miles/hr for 3 hours, calculate the distance it will travel
a)
90 miles
b)
10 miles
c)
600 miles
d)
90 km
35.
A speed boat travels 200 miles at a speed of 20 miles/hr. How much time will it take to travel the 200 miles?
a)
10 hrs
b)
10 miles
c)
400 hrs
d)
100 km
36.
Mr. Rudman drives his race car for 4 hrs at 150 miles/hr. How far will he travel?
a)
600 km
b)
60 miles
c)
6 miles
d)
600 miles
37.
How long did it take this object to travel back to its reference/starting point?
a)
20 s
b)
30 s
c)
60 s
d)
100 s
38.

What is happening in this graph from point B to C?

a)

The object is going down a hill.

b)

The object is returning to its starting location.

c)

The object is slowing down.

d)

The object is staying still.

39.
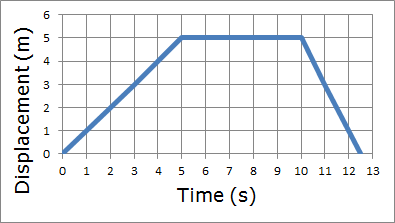
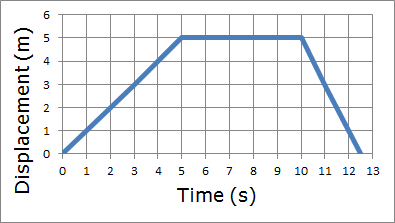
What is the person doing from 5 seconds to 10 seconds?
a)
Walking 
b)
Running
c)
Standing Still 
d)
Walking Fast
40.

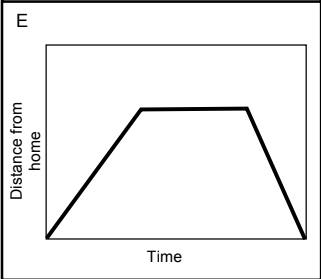
Select all that apply.

a)

Travels towards home

b)

Travels away from home

c)

Goes at a steady, slow speed

d)

Slows down

e)

Speeds up

41.

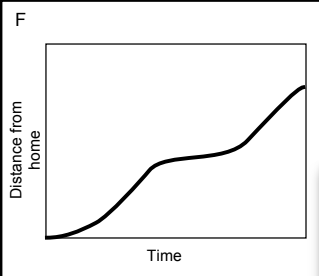
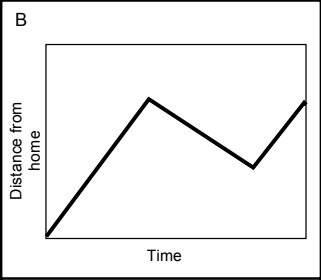
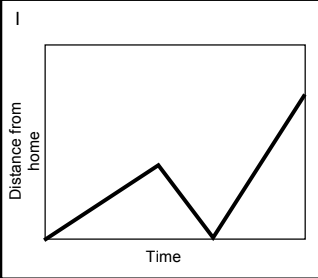
Susie went to the store, when she got there she realized that she forgot her wallet and returned home.


Which graph matches this motion?
a)
b)
c)
d)
42.

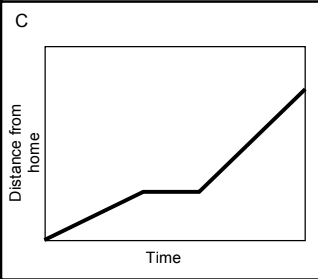
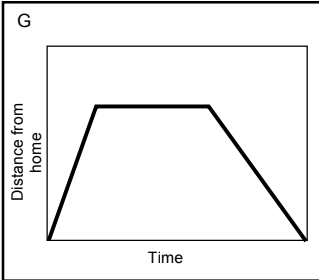
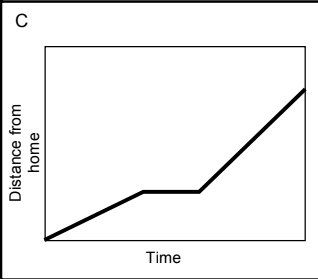
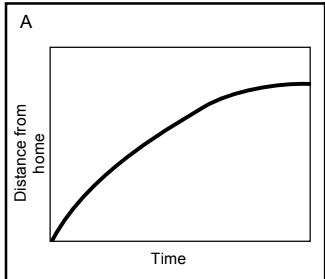
Deb walked to the ice cream shop. Sat and ate her ice cream and then went for a run.


Which graph matches this motion?
a)
b)
c)
d)
43.

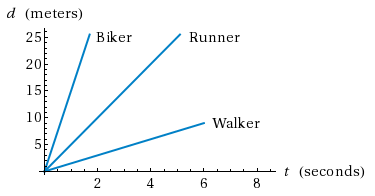
Which person moved the fastest in 3 seconds?

a)

biker

b)

runner

c)

walker

d)

they are all moving equally

44.

Which best describes this graph?

a)

moving forward at a constant speed, increasing speed

b)

moving forward at a constant speed, stopping, returning to the start at a constant speed.

c)

moving quickly, then moving slower

d)

moving forward at a constant speed, stopping, continuing to move forward

45.

Terrance's route to and from his meeting is shown in the graph. When was Terrance traveling the fastest?

a)

On the way home from the meeting

b)

At the meeting

c)

On the way to the meeting

d)

His route there and back was a consistent speed
46.

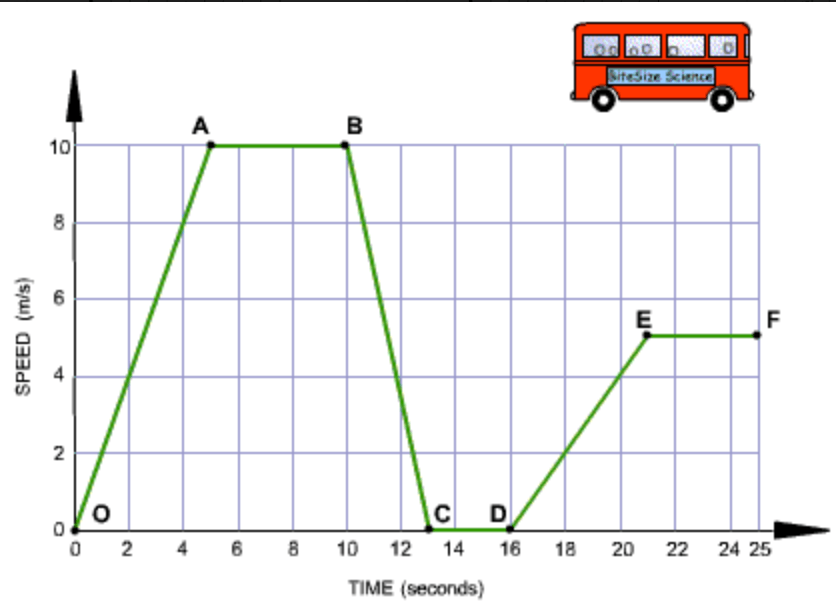
Segment O-A: The bus is _________________. It's speed changes from 0m/s to 10 m/s in 5 seconds.

a)

accelerating

b)

decelerating

c)

constant speed

d)

at rest

47.

What does this graph represent?

a)

Two objects at constant speeds

b)

Two objects accelerating

c)

Two objects at rest (not moving)

48.
According to the graph how fast does the person travel in the first 5 seconds?
a)
2 m/s
b)
10 m/s
c)
12.5 m/s
d)
1 m/s
49.

What type of motion does section B show?

a)

Stationary

b)

Constant Speed

c)

Accelerating

d)

Decelerating

e)

Can't say

50.

What type of motion does section D show?

a)

Stationary

b)

Constant Speed

c)

Accelerating

d)

Decelerating

e)

Can't say

51.
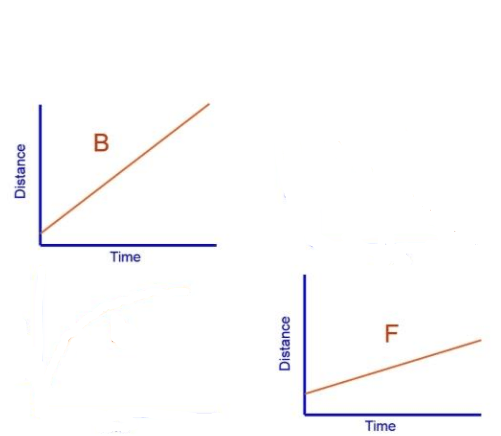
Which graph is showing a faster constant speed?
a)
B
b)
F
c)
They show the same speed
52.
At 60 seconds, how far had this object traveled? 
a)
0 m
b)
10 m
c)
20 m
d)
40 m
53.

What happened during E to F point?

a)

not moving

b)

increasing speed at a constant rate

c)

constant speed

d)

acceleration

54.

What happened during B to C point?

a)

deceleration

b)

constant speed

c)

at rest

d)

acceleration

55.
Which graph shows the object standing still?
a)
A
b)
B
c)
C
d)
D