
 Worksheets
Algebra Module 2 Cumulative Quizizz
Total questions: 60
Worksheet time: 3600secs

Type of Data arrangement
Symmetrical
Hairline
Skewed Right
Skewed Left

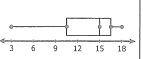
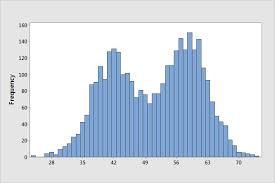
What is the shape of the distribution?
Skewed Left
Skewed Right
Symmetric
Bimodal
3, 5, 7, 4, 3, 1


What is the range?
6
2 - 8
3
4

What is the interquartile range?
3
6
4
5

What is the third quartile?
7
6
8
3
What is the standard deviation for the data given:
5, 10, 7, 12, 0, 20, 15, 22, 8, 2
6.89
10.1
7.26
9
What is the standard deviation for the data given:
5, 10, 7, 12, 0, 20, 15, 22, 8, 2
6.89
10.1
7.26
9

Ervin bowled 7 games last weekend. His scores are: 155, 165, 138, 172, 127, 193, 142. What is the sample standard deviation of Ervin's scores?
511.33
22.61
438.48
20.94
2, 5, 12, 15, 19, 4, 6, 11, 16, 18, 12, 12, 42
What effect does removing the outlier have on the distribution of the data?
56, 64, 73, 59, 98, 65, 59
If the outlier is removed from the data set, which measure of central tendency will be least affected?
When using IQR to find outliers, which formula will identify the lower limit?
Q3 - 1.5(IQR)
Q1 + 1.5(IQR)
Q1 - 1.5(IQR)
Q3 + 1.5(IQR)

Which value(s) are outlier(s) for the age of male Oscar winners?
80
76
60
29


Which is a true statement based on the box plots above
The data for Team B have the greater range.
The data for Team A are more symmetric.
The data for Team B have the greater interquartile range.
The data for Team A have the greater median.

The box plots show data from a survey of students under 14 years old. They were asked on how many days in a month they read and draw. Based on the box plots, which is a true statement about the students?
Most students draw at least 12 days a month.
Most students read less than 12 days a month.
Most students read more often than they draw.
Most students draw more often than they read.


The ratio of a joint relative frequency to a related marginal relative frequency in a two-way table.
Conditional Relative Frequency
Joint Relative Frequency
Marginal Relative Frequency
Relative Frequency

What is the row conditional relative frequency of students with hazel eyes that also have red hair?
1/9
9/60
1/60
1/3

What is the column conditional relative frequency of students with green eyes that also have blond hair?
1/9
9/60
7/13
2/13


Which scatterplot does NOT suggest a linear relationship between x and y?


What is the equation of the line of best fit?
y = -25x + 170
y = -5/8x + 170
y = 25x + 170
y = 5/8x + 170

How many laps can a bicycle make around the park in 23 minutes?


The table shows the height of a tree for various years after it was planted. Using the line of best fit, how tall would the tree be 30 years after it was planted?
22 feet
23 feet
36 feet
37 feet


Shown is a residual plot. How many positive residuals are there?
5
1
3
9
The equation of the least squares regression line is y = 1.3 + 0.73x. What is the residual for the point (4,7)?
2.78
3.00
4.00
4.22

After performing analyses on a set of data, Mrs. Schoeneck examined the scatter plot of the residual values for each analysis. Which scatter plot indicated the best linear fit for the data?
A
B
C
None of the above

This residual plot represents a linear fit.
This residual plot represents a nonlinear fit.
This residual plot represents no fit.
The residual plot represents an exponential fit.
What should a residual plot look like if the data is linear?
Distinct pattern, no matter the shape
Curve
Random
Linear

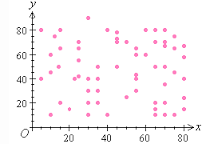
What type of correlation does this graph show?
A) Positive
B) negative
C) none
D) all of the above

The scatter plot below shows the number of books read by students in Mrs. Hall’s English class and their final grades. Which statement represents the best description about the line of best fit?
A) The more books students read, the lower their English grade.
B) The more books students read, the higher their English grade.
C) The fewer books students read, the higher their English grade.
D) No relationship exists between the number of books students read and their English grades.


Estimate the correlation coefficient for this scatterplot.
A) r = -0.9
B) r = 1
C) r = 0.9
D) r = -1

Estimate the correlation coefficient.
r is close to zero
r is close to -1
r is close to 1
r is close to -1.5
r is close to 1.5


