
 Worksheets
Statistics and Probability
Total questions: 35
Worksheet time: 2hrs 2mins
Name
Class
Date
1.

What is the median of this data?
a)
6.5
b)
9
c)
10.5
d)
8
2.

What is the mean (average) of this data? Round to the nearest tenth.
a)
8.0
b)
8.3
c)
7.5
d)
9.0
3.

What is the mode of this data?
a)
7
b)
10
c)
8
d)
6.5
4.

What is the range of this data?
a)
4
b)
10.5
c)
6.5
d)
9
5.
Find the median:
3, 5, 7, 4, 3, 1
3, 5, 7, 4, 3, 1
a)
3 and 4
b)
There isn't one
c)
3.5
d)
3
6.
Blood type
a)
Categorical
b)
Quantitative
7.
Waiting time in a waiting room
a)
Categorical
b)
Quantitative
8.
Calories in ice cream
a)
Categorical
b)
Quantitative
9.
Categorical or Quantitative?
Years of schooling completed
Years of schooling completed
a)
Categorical
b)
Quantitative
10.
Categorical or Quantitative?
College Major
College Major
a)
Categorical
b)
Quantitative
11.
Which of the following is an example of categorical data?
a)
High School Graduate or Not
b)
Annual Income
c)
Years of Schooling Completed
d)
Years of playing an instrument
12.
Which of the following is an example of quantitative data?
a)
The color of your car
b)
A person's state of residence
c)
A person's Zip Code
d)
A Person's Height
13.
Mode means?
a)
Average
b)
Middle
c)
Most Frequent
d)
Standard deviation
14.
A data value that is much higher or much lower than the other values in a data set.
a)
outlier
b)
inlier
c)
immalier
d)
sublier
15.
In a data display, a grouping of data that is close together is a...?
a)
cluster
b)
median
c)
peak
d)
gap
16.

a)
only 2nd period is symmetric
b)
both plots are symmetric
c)
5th period is bimodal
d)
2nd period's center is higher than 5th period
17.
If a data set is bimodal, how many modes does it have?
a)
1
b)
2
c)
3
d)
4
18.

Which of the following best describes the shape of the distribution?
a)
SKEWED LEFT
b)
SKEWED RIGHT
c)
UNIFORM
d)
SYMMETRICAL
19.

Which of the following best describes the shape of the distribution?
a)
SKEWED LEFT
b)
SKEWED RIGHT
c)
UNIFORM
d)
SYMMETRICAL
20.

Which of the following best describes the shape of the distribution?
a)
SKEWED
b)
BIMODAL
c)
UNIFORM
d)
SYMMETRICAL
21.
Find the MAD:
58, 38, 54, 48, 26, 36
58, 38, 54, 48, 26, 36
a)
43
b)
20
c)
10
d)
12
22.

Find the Mean Absolute Deviation: 5, 11, 2, 7, 16. The Mean is 8.2
a)
3.2
b)
2.8
c)
1.2
d)
4.2
23.

What is the minimum value?
a)
64
b)
58
c)
66
d)
60
24.

What is the maximum value?
a)
58
b)
66
c)
64
d)
60
25.

What data value is the upper quartile (Q3)?
a)
64
b)
62
c)
66
d)
58
26.

What value is the lower quartile?
a)
66
b)
58
c)
60
d)
64
27.

What is the median?
a)
62
b)
58
c)
66
d)
60
28.

What data value is the upper quartile?
a)
64
b)
62
c)
66
d)
58
29.
Probability is ...
a)
the chance that some event will occur.
b)
a game that involves coins.
c)
a guarantee.
30.
Probability can be written as ...
a)
a fraction
b)
a decimal
c)
a percent
d)
all of the above
31.
What is the probability of flipping a coin and getting heads?
a)
1/2
b)
1/3
c)
1/4
d)
Never, Tails never fails.
32.

A bag contains 5 quarters, 2 dimes, and 4 pennies. What is the probability of picking a quarter?
a)
5/11
b)
5/6
c)
1/3
d)
5
33.
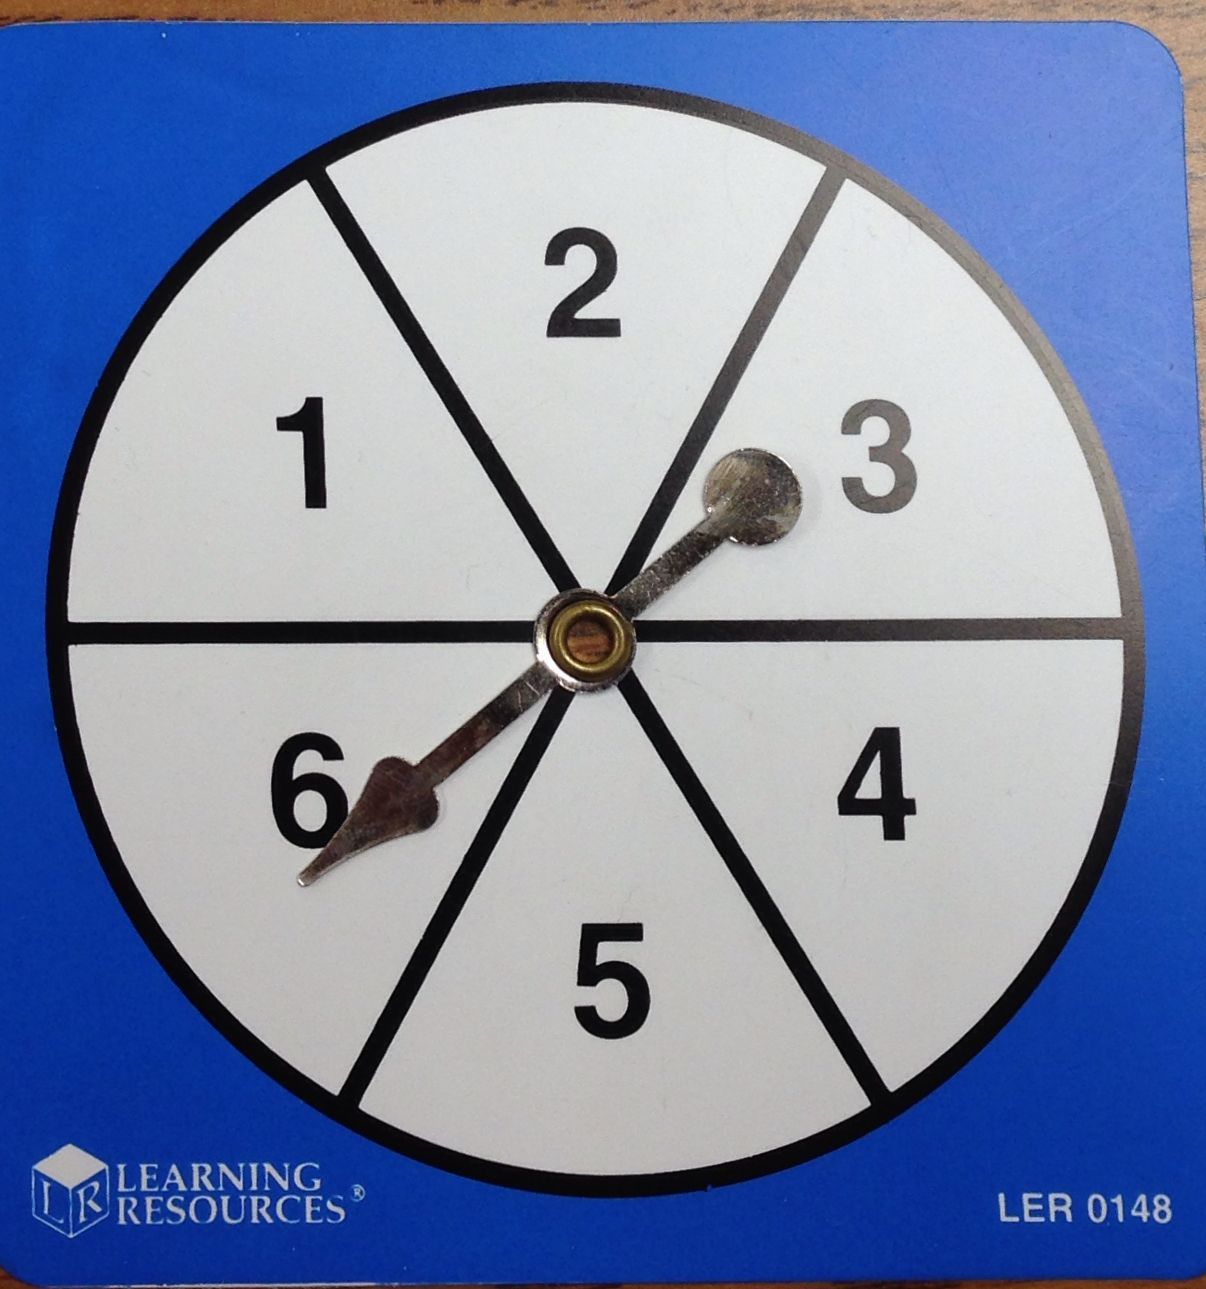
What is the probability of spinning an even number?
a)
16 2/3%
b)
33 1/3%
c)
50%
d)
75%
34.
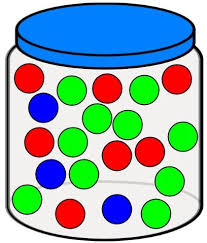
What is the probability of pulling a red marble out of a jar of marbles that have 10 green marbles, 7 red marbles and 3 blue marbles?
a)
1/7
b)
7/20
c)
7/10
d)
3/10
35.
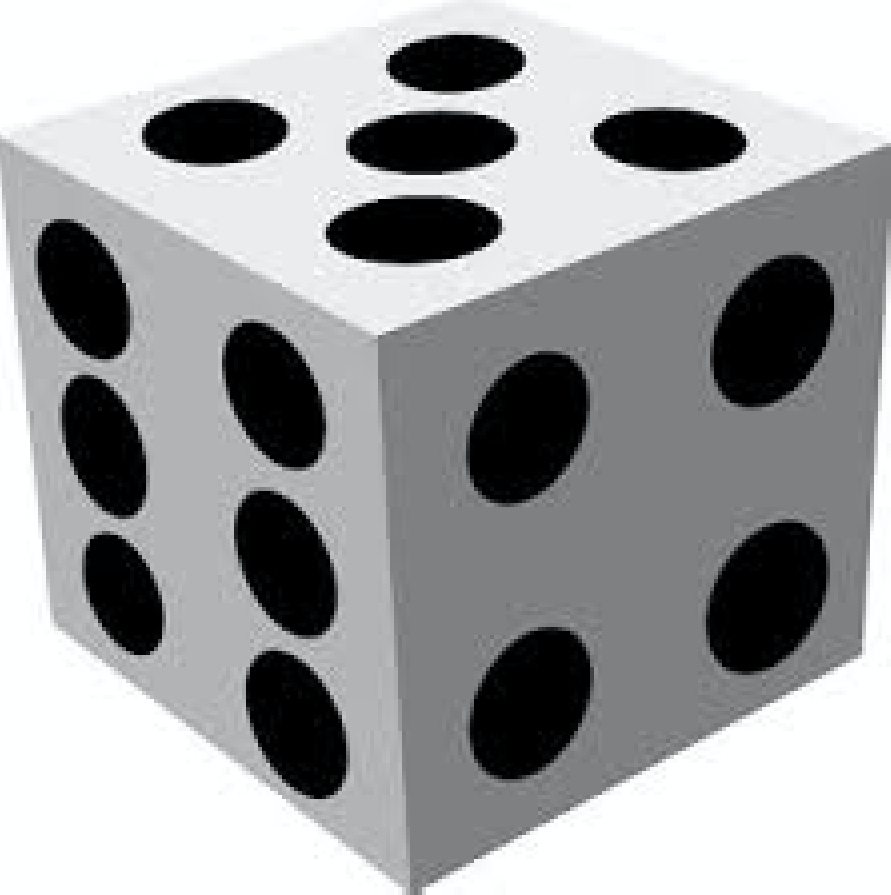
If you were to roll the die one time what is the probability of it landing on a 2?
a)
2 out of 6
b)
2 out of 2
c)
1 out of 6
d)
1 out of 1
100 %

