
 Worksheets
Measures of Center, Spread, and Shapes of Distributions
Total questions: 50
Worksheet time: 2hrs 40mins
To find the mean of a set of numbers, add up all the items and divide by...
2 (half)
The minimum of the data set
The maximum of the data set
The number of items in the data set
36, 42, 28, 52, 48, 36, 31
What is the median number of miles Jenna cycled?
TRUE OR FALSE:
In order to find the median, the data must be sorted from least to greatest first.
True
False
The number of text messages that Isaac received each day for a week is shown: 47, 49, 54, 50, 48, 47, 55
What is the MEAN and the MEDIAN?
Mean=49
Median=54
Mean=49
Median=50
Mean=50
Median=54
Mean=50
Median=49
TRUE OR FALSE:
The range is the difference between the greatest and the least data values.
True
False


The shapes of both plots are symmetrical.
The data spreads for both populations are the same.
Route 9 is skewed left.
Route 9 is skewed right.
Both plots have outliers.

Which measure of center is more appropriate, the mean or the median? Why?
Mean because this is a skewed data set.
Median because this is a skewed data set
Mean because this set is normally distributed.
Median because this set is normally distributed.

The shape of the distributions is _______________________________________.
Skewed left
Skewed right
Select all the true statements about this data set:
2, 57, 38, 42, 6
The mean is 29.
The range is 55.
There is no mode.
The median is 38.

What is the shape of the distribution?
Skewed Left
Skewed Right
Symmetric (normal)

How would you describe this distribution?
Left skewed
Symmetrical (normally distributed)
Right Skewed

Which of the following best describes the shape of the distribution?
slightly skewed left
very skewed right
symmetrical (normal)

Which of the following best describes the shape of the distribution?
skewed left
skewed right
symmetrical (normal)

2nd period is skewed left.
Both plots are symmetric.
5th period is skewed right.
2nd period's center is higher than 5th period.

Select all the TRUE statements.
The median wait time for both rides is 35.
The Red Racer has a lower maximum than the Wild Viper.
The Wild Viper has a larger spread than Red Racer.
The Red Racer has a larger IQR than the Wild Viper.

the shape is skewed to the right
the shape is symmetric
the shape is skewed to the left

Which statement is NOT true?
the spread for Reybold and Picktown are not the same
neither box plot is symmetrical
the medians are different
the minimum for Picktown is 5 lower than the minimum for Reybold

Which measure of center is more appropriate, the mean or the median?
Mean
median

Select the correct values for the mean and median.
Which value is smaller: the mean or the median?
The mean is 22.5, and the median is 22. So, the median is smaller.
The mean is 20, and the median is 22. So, the mean is smaller.
The mean is 22, and the median is 22.5. So, the mean is smaller.
The mean is 22, and the median is 20. So, the mean is smaller.

75% of the Cruisers went to more than 13 car shows. True or False?
True
False

Which club has the smaller spread?
Cruisers
Car Hops

Each dot represents 1 day. How many days were recorded?
9
21
20
105


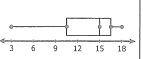
Which of the following best describes the shape of the distribution?
skewed left
skewed right
symmetrical (normal)
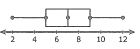
Which of the following best describes the shape of the distribution?
skewed left
skewed right
symmetrical (normal)
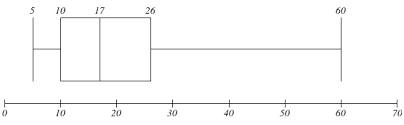
This distribution is skewed to the (a) .


Since this data is _______________, the __________ would be the best measure of center.
symmetrical, median
symmetrical, mean
skewed, median
skewed, mean


What is the spread of this data?
7
10
4
9.5
If data has outliers, the _____________ is the best measure of center.
Median
Mode
Mean
If the data does not have outliers, the _________ is the best measure of center.
mean
median
Is there an outlier in the following set of data?
8, 45, 45, 47, 48, 48, 49, 50
yes
no

Which measure of center should you use for the following data distribution?
mean
median
Given that the data is symmetric, which pair of measures should be used to represent the data?
center: median
spread: standard deviation
center: mean
spread: IQR
center: mean
spread: standard deviation
center: median
spread: IQR

What is the shape of the distribution?
symmetric
skewed to the left
skewed to the right

Which distribution has a larger Interquartile Range?
Type A or B in the box below to answer this question.
(a)

Which distribution has the largest median?
A
B
C

Which distribution has the smallest IQR? What is the value of the IQR?
C, IQR= 20
B, IQR= 5
A, IQR= 6

Distribution B is ______________
symmetric
skewed left
skewed right


Which statement is true?
Airplane A has a lesser median
Airplane B has a greater range
Airplane A has a less predictable flight length
Airplane B a lesser IQR

What is the range?
10
12
15
2 - 12

Since this data is ____________________, the _____________ is a better measure of center.
skewed, mean
skewed, median
symmetrical, mean
symmetrical, median

Because this distribution is ____________ to the ___________, we would use the ______________ for the center and the _____________ for the spread of the data.
symmetric, middle, median, IQR
skewed, left, median, IQR
skewed, left, mean, IQR
skewed, right, median, standard deviation

