
 Worksheets
Class 8 QUIZ - Motion
Total questions: 50
Worksheet time: 2hrs 38mins

Which runner stopped for a rest?
Albert
Bob
Charlie


What does this Distance-Time graph represent?
Constant speed
Increasing speed (acceleration)
Not moving
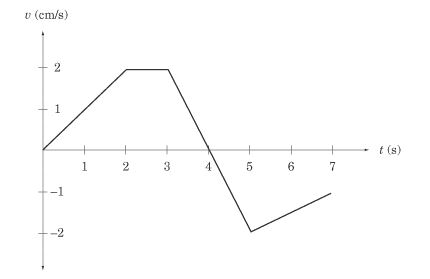
What is happening between 2 and 3 seconds?
The object is not moving.
The object is not accelerating.
The object is slowing down.
The object is speeding up.

What is happening between 3 seconds and 4 seconds?
The object is moving in a negative direction.
The object is returning to its starting position.
The object is slowing to a stop.
The object is changing direction.
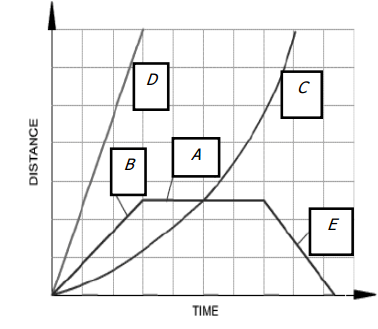
What is happening at E?
Stationary
Accelerating
Fast steady speed; moving away from the starting position
Steady speed; returning to start position
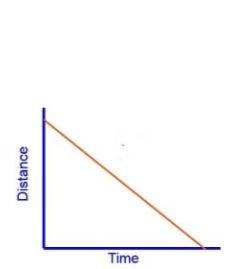
What is the line on this Distance-Time graph showing?
moving away from starting point at a constant speed
moving back towards the starting point at a constant speed
acceleration (getting faster)
deceleration (getting slower)

During which interval is the object traveling at a constant velocity?
B to C
D to E
F to G
All of the above

During which intervals is the object speeding up?
A to B
B to C
D to E
G to H
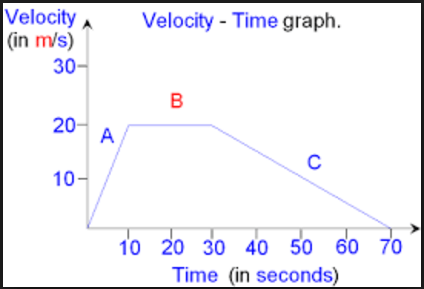
This is a velocity-time graph. What is the object doing in segment C?
Accelerating
Decelerating
Moving with constant speed
Not moving

This distance-time graph shows an object that is
Accelerating
Moving with constant speed
Decelerating
Stationary
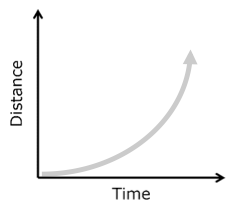
This distance-time graph shows an object that is
Accelerating
Moving with constant speed
Decelerating
Stationary

This distance-time graph shows an object that is
Accelerating
Moving with constant speed
Decelerating
Stationary

This distance-time graph shows an object that is
Increasing speed away from the start
Moving away from the start at a constant speed
Decreasing speed toward the start
Moving toward the start at a constant speed
This distance-time graph shows an object that is
Accelerating
Moving with constant speed
Decelerating
Stationary

This distance-time graph shows an object that is
Increasing speed toward the start
Moving away from the start at a constant speed
Decreasing speed away from the start
Moving toward the start at a constant speed


This speed-time graph shows an object that is
Moving with constant speed
Accelerating
Decelerating
Stationary

This speed-time graph shows an object that is
Moving with constant speed
Accelerating
Decelerating
Stationary

This speed-time graph shows an object that is
Moving with constant speed
Accelerating
Decelerting
Stationary

This speed-time graph demonstrates an object that is
Moving with constant speed
Accelerating
Decelerating
Stationary

Which distance-time graph is showing acceleration (incresing speed)?
D
E
both D and E
neither D or E
Which distance -time graph is showing deceleration (decreasing speed)?
D
E
both D and E
neither D or E

How long did it take this object to travel 10 m?
0 s
10 s
15 s
20 s

At 60 seconds, how far had this object traveled?
0 m
10 m
20 m
40 m

The speed-time graph shows the motion of a person riding a bike.
What is happening during A to B point?
not moving
increasing speed at a constant rate
moving at a constant speed
acceleration

The speed-time graph shows the motion of a person riding a bike.
What happened during C to D point?
not moving
increasing speed at a constant rate
moving at a constant speed
moving at 0 m/s2 acceleration

The speed-time graph shows the motion of a person riding a bike.
What happened during E to F point?
not moving
increasing speed at a constant rate
constant speed
acceleration

The speed-time graph shows the motion of a person riding a bike.
What happened during B to C point?
deceleration
constant speed
at rest
acceleration


What is the velocity at 12.5 seconds?
0 m/s
2 m/s
10 m/s
20 m/s
What is the acceleration during interval A?
0 m/s/s
2 m/s/s
10 m/s/s
20 m/s/s
What is the acceleration during interval B?
0 m/s/s
2 m/s/s
10 m/s/s
20 m/s/s
What is the acceleration during interval C?
0 m/s/s
-2 m/s/s
-1.33 m/s/s
-20 m/s/s
What is the displacement from 0-10 seconds?
10 m
10 m
100 m
200 m
What is the displacement from 15-30 seconds?
150 m
-150 m
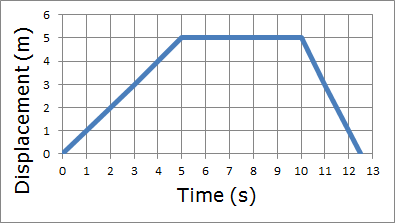
According to the graph, what is the total distance traveled by the person?
2 m
10 m
0 m
5 m
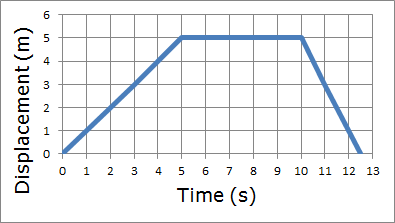
What is the person doing from 5 seconds to 10 seconds?
Walking
Running
Standing Still
Walking Fast
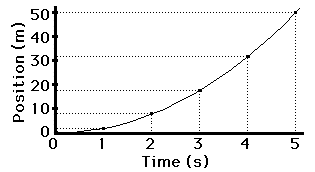
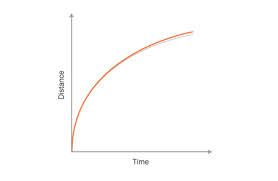
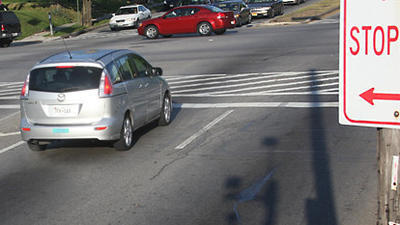
A stopped car begins moving and reaches a speed of 30m/s in 5 seconds. What is its acceleration?
-25m/s2
+6m/s2
+5m/s2
-5m/s

Colin skateboards down the sidewalk in front of the school, traveling at 24 km/h. How much time would it take him to travel 6.0 km?
0.25 h
0.4 h
5.4 h
12 h
A little freshman moves down the hall at 4.2 m/s. When he sees Luke coming, he slows down. After 4.2 s, he is moving at 1.2 m/s. What is his acceleration?
+0.25 m/s2
-0.7 m/s2
+0.625 m/s2
-12 m/s2
Kendra is coming home late, past her curfew. As she sneaks quietly into her house trying not to wake up her parents, she slinks up the stairs moving 10.7 m in 15.3 s. Find her speed.
0.4 m/s
2.0 m/s
7.1 m/s
0.7 m/s
Ricky chucks a water balloon at his friend. Running for his life, he travels 120 m in 9.83 s. What was his average speed?
12.2 m/s
9.1 m/s
10.2 m/s
8.3 m/s
Looking for some good old-fashioned fun, Andrew decides to slide down the hill on a toboggan. Calculate the time it takes him to reach the bottom of the hill if he accelerates at a rate of 4 m/s2 to achieve a speed of 28 m/s.
8 s
2 s
7s
4 s

