
 Worksheets
Motion graphs
Total questions: 20
Worksheet time: 13mins


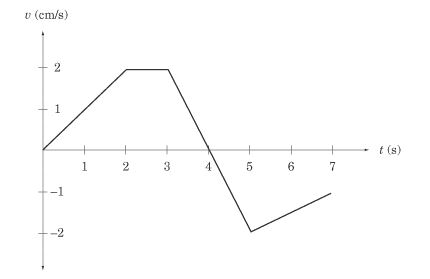
What is happening between 2 and 3 seconds?
The object is not moving.
The object is not accelerating.
The object is slowing down.
The object is speeding up.
What is happening between 2 and 3 seconds?
The object is not moving.
The object is not accelerating.
The object is slowing down.
The object is speeding up.

What is happening between 3 seconds and 4 seconds?
The object is moving in a negative direction.
The object is returning to its starting position.
The object is slowing to a stop.
The object is changing direction.
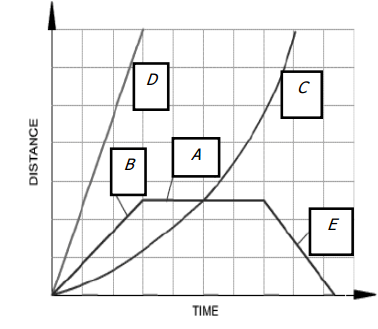


What is occurring on this graph?
Negative acceleration
moving at a constant speed in the positive direction
positive acceleration
negative net force

Image A matches graph:
1
2
3
4
5
Image C matches graph:
1
2
3
4
5
Image B matches graph:
1
2
3
4
5

On this position vs time graph, what is the velocity?
40 m/s
8 m/s
5 m/s
0 m/s

On this position vs time graph, what is the velocity from 15 to 40 seconds?
-4 m/s
-10 m/s
-25 m/s
-100 m/s

What is the acceleration during interval A?
0 m/s/s
2 m/s/s
10 m/s/s
20 m/s/s
What is the acceleration during interval B?
0 m/s/s
2 m/s/s
10 m/s/s
20 m/s/s
What is the acceleration during interval C?
0 m/s/s
-2 m/s/s
-1.33 m/s/s
-20 m/s/s


