
NEW
Font size
S
M
L
XL
 Worksheets
Tally Charts, Bar Graphs, and Picture Graphs
Total questions: 16
Worksheet time: 10mins
Name
Class
Date
1.
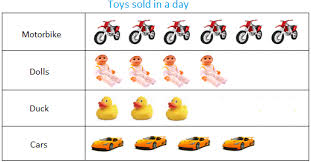
What type of graph is this?
a)
bar graph
b)
picture graph
c)
tally chart
2.

What type of graph is this?
a)
bar graph
b)
picture graph
c)
tally chart
3.

How many students like soccer and softball?
a)
9
b)
4
c)
13
d)
15
4.

Which fruit got the most votes?
a)
Grapes
b)
Bananas
c)
Apples
d)
Pears
5.

Which dinosaur did students like the best?
a)
Stegosaurus
b)
Triceratops
c)
T-rex
6.

What type of graph is this?
a)
Picture graph
b)
Bar graph
c)
Tally Chart
7.

Which sport did people like the LEAST?
a)
baseball
b)
soccer
c)
basketball
8.

How many tally marks do you have on Monday?
a)
15
b)
20
c)
10
d)
12
9.

Which sentence correctly describes the graph?
a)
The fewest people chose grapes.
b)
The most people chose pears.
10.

How many more people like red than purple?
a)
100
b)
10
c)
2
d)
5
11.

How many votes do math and reading have together?
a)
8
b)
6
c)
14
d)
3
12.

How many people were surveyed ?
a)
9
b)
10
c)
11
13.

How many people like football and basketball?
a)
9
b)
4
c)
10
d)
2
14.

How many more people chose ladybug than bumblebee?
a)
3
b)
5
c)
4
15.

How many more children chose math than reading?
a)
5 children
b)
2 children
c)
4 children
16.
How many people chose apple and pears as their favorite fruit?
a)
17
b)
15
c)
16
d)
18
Reset

