
NEW
Font size
 Worksheets
End of Year Graphs and Transformations Review
Total questions: 20
Worksheet time: 37mins

The equation of red graph is y = x2. What is the equation of the blue graph?
y = (x + 2)2 + 3
y = 3(x + 2)2
y = (x - 2)2 + 3
y = (x + 2)2 - 3

The line of symmetry of the blue graph is...
y = 4
x = -4
(-4, -2)
y = -4

Which function defines the graph?
f(x) = |x - 4| + 3
f(x) = |x - 3| + 4
f(x) = -|x + 4| + 3
f(x) = |x + 4| + 3

Which function defines the graph?
f(x) = -2|x - 3| + 4
f(x) = -2|x - 4| + 3
f(x) = -2|x + 3| + 4
f(x) = -2|x + 4| + 3

What type of function is shown?
quadratic
square root
linear
exponential

What are the transformations of this functions compared to the parent function?
translated down 2 units
translated up 2 units
translated left 2 units
translated right 2 units

Which of the following graphs represent the equation shown?
A
B
C
D
Which of the following is the graph of y=(x−2)3−4


Which of the following is the graph of y=(x+5)3−1


Which of the facts is NOT true about the graph shown?
The range is y ∈ ℝ
The function has been shifted 6 units right.
The function has been shifted up 1 unit
The function has been vertically stretched by a factor of 2.

Which of the following equations produces the given graph?
y=log2x
y=x1
y=2x
y=∣x∣


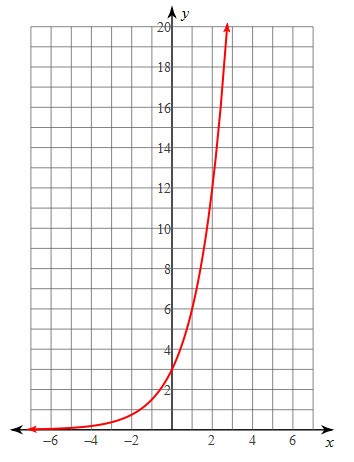
Which graph best represents the following logarithmic function?
y=log2x


Which of the following equations produces the given graph?
y=log2x
y=x1
y=2x
y=∣x∣
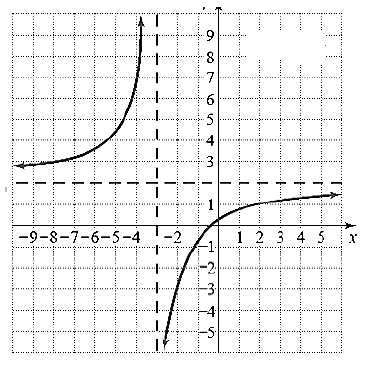
Which of the following represents the graph below?
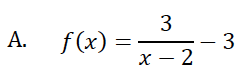
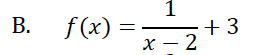
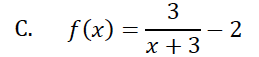
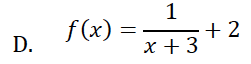

Which of the following represent the graph?



