wayground logo

Free Printable Worksheets

Font size

S
M
L
XL
Worksheets

Probability/Two Way Frequency

Total questions: 25

Worksheet time: 3hrs 45mins

Name
Class
Date
1.
What percentage of males drive sports cars?
a)
35%
b)
16.25%
c)
65%
d)
25%
2.
How many people purchased no food and no drink?
a)
60
b)
10
c)
20
d)
200
3.
What color car is the least popular at this car dealership?
a)
Red
b)
White
c)
Blue
d)
Green
4.
What percentage of the students were boys?
a)
20%
b)
25%
c)
40%
d)
50%
5.
Which age group liked Action movies the least?
a)
18-25
b)
25-49
c)
50+
d)
238
6.
How many total people were surveyed about what ice cream flavor they would pick?
a)
107
b)
92
c)
70
d)
269
7.
Probability can be written as ...
a)
a fraction
b)
a decimal
c)
a percent
d)
all of the above
8.
A jar contains 2 pink, 6 red, and 4 blue marbles. If you pick one marble without looking, what is the probability that the marble you pick will be red or blue?
a)
5/6
b)
1/2
c)
1/3
d)
1/6
9.
What is the probability of flipping a coin and getting heads?
a)
1/2
b)
1/3
c)
1/4
d)
Never, Tails never fails.
10.
The probability of it raining today is 30%.  What is the probability that it will NOT rain?
a)
30%
b)
70%
c)
100%
d)
0%
11.
A set of all possible outcomes is known as - 
a)
a list
b)
a complement
c)
a sample space
d)
an event
12.
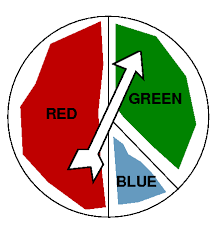
What is the probability of spinning the spinner and having it land on RED?
a)
33%
b)
50%
c)
12%
13.
A bag contains 5 quarters, 2 dimes, and 4 pennies. What is the probability of picking a quarter?
a)
5/11
b)
5/6
c)
1/3
d)
5
14.
What is the probability of drawing a red card from a standard deck of cards?
a)
1/52
b)
13/52
c)
1/2
d)
4/52
15.
If you were to roll the die one time what is the probability of it landing on a 2?
a)
2 out of 6
b)
2 out of 2
c)
1 out of 6
d)
1 out of 1
16.

A class survey asks students of their theatre preferences of comedy or mystery. The results are shown in the given table. Based on this survey, what is the probability of a male from this school choosing mystery?

a)

60/105

b)

60/95

c)

60/188

d)

60/83

17.

A survey of 15-18 year olds asked if they used Twitter, or not. The results are shown in the given table. What is the probability that a person chosen at random is female who does not use Twitter?

a)

64/395

b)

206/395

c)

32/395

d)

236/395

18.

Freshman girls and boys were surveyed to choose their favourite subject from the list of Math, English or Science. The results are shown in the two-way relative frequency table. If a student is chosen at random from this group, what is the probability that the student is a girl who chose math?

a)

27%

b)

33%

c)

39%

d)

40%

19.

What number should go in the blue box?

a)

21

b)

135

c)

19

d)

22

20.

How many total have no cell phone?

a)

13

b)

9

c)

22

d)

100

21.

How many female students are taking physics?

a)

14

b)

19

c)

33

d)

24

22.

This table shows the number of female and male students in each science class. How many students are taking biology?

a)

18

b)

8

c)

80

d)

26

23.
How many senior boys play football and wrestle?
a)
9
b)
12
c)
18
d)
39
24.
How many senior boys play football but do not wrestle?
a)
9
b)
12
c)
18
d)
104
25.
How many senior boys play football or wrestle?
a)
9
b)
21
c)
30
d)
39