
 Worksheets
statistics
Total questions: 25
Worksheet time: 1hrs 21mins
Calculate the MEAN for the data set: 6, 7, 12, 8, 7, 4, 8, 8, 7
7
7.44
8
7 and 8
Calculate the MEDIAN for the data set: 6, 7, 12, 8, 7, 4, 8, 8, 7
7
7.44
8
7 and 8
Calculate the MODE for the data set: 6, 7, 12, 8, 7, 4, 8, 8, 7
7
7.44
8
7 and 8
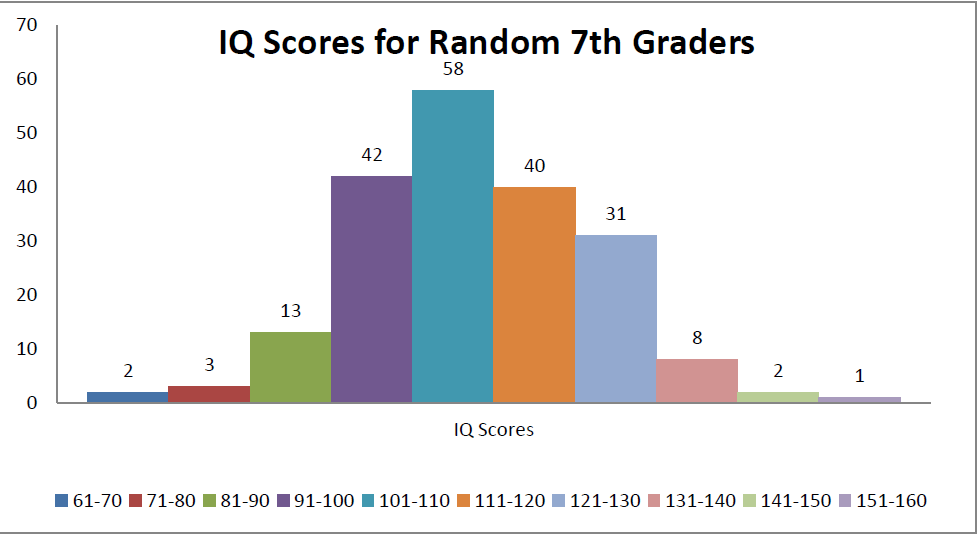
Calculate the relative frequency of having an IQ score in the 131-140 range. (200 7th graders were surveyed).
8%
4%
20%
15.5%
How many 7th graders had an IQ score in the 81-90 range?
13
6.5
3
42

How many data points are greater than 34?
10
11
12
13

Kayaking
Cycling
Swimming
Running

15 students out of 20 succeed in Math quiz. The percentage of students who succeed is:
25%
0.75
75%
None of choices
Calculate the mean and median for the data set: 6, 7, 12, 8, 7, 4, 8, 8, 7
mean: 7 median: 7
mean: 7.44 median: 8
mean: 7 median: 7.44
mean: 7.44 median: 7

Using the frequency table, determine which statement is true.
The mean is larger than the median.
The median is larger than the mean.
The mean and median are the same.
Cannot be determined
Range means
Most frequent
Average
Largest minus smallest
In the middle
The heights of 4 different people are: 1.55m, 1.52m, 1.81m, and 1.91m. The range of these heights is:
0.21m
0.27m
0.16m
0.39m
. Mean of 20 observations is 17. If in the observations, observation 40 is replaced by 12, find the new mean
15.6
15.5
17
18
Mean of 36 observations is 12. One observation 47 was misread as 74. Find the correct mean
Answer.
11.20
11.25
15
16
Determine the mean of first 10 natural numbers.
5.5
5.6
10.5
11.5
Write the class mark of an interval 90 – 120.
105
110
95
100
If the median of data (arranged in ascending order) 31, 33, 35, x, x+10, 48, 48, 50 is 40, then find value of x.
40
35
50
60
The scores of an English test out of 100 of 20 students are given below :
75, 69, 88, 55, 95, 88, 73, 64, 75, 98, 88, 95, 90, 95, 88, 44, 59, 67, 88, 99.
Find the median
90
88
95
100

A teacher wanted to analyse the performance of two sections of students in a mathematics test of 100 marks. Looking at their performances, she found that a few students got under 20 marks and a few got 70 marks or above. So she decided to group them into intervals of varying sizes as follows
0 – 20, 20 – 30, …, 60 – 70, 70 – 100. Then she formed the following table
Find the probability that a student obtained less than 20% in the mathematics test
7/90
20/90
15/90
1/90
What is the middle number, or the mean of the two middle numbers, in an ordered set of data?
mode
median
IQR
lower quartile

