wayground logo

Free Printable Worksheets

Font size

S
M
L
XL
Worksheets

Term 3 Week 9 Homework Task

Total questions: 15

Worksheet time: 27mins

Name
Class
Date
1.
A scientist discovers the body of an unknown species of frog in the rain forest of Brazil.  She writes several statements in her journal about the animal shown above.  Which of the following is an observation about the frog?
a)
The frog might be poisonous because it is very brightly colored.
b)
It has a mass of 22.4 grams.
c)
The frog is probably a tree climber because it has large, round toe pads.
d)
I think the frog is a species of poison dart frog because of its size and color.
2.
A student placed 50 mealworms in the middle of an aquarium containing a light, a cardboard tube and a water dish.  He waited five minutes and then recorded the data for the first trial in the table above.  The student repeated this procedure two more times, and recorded the results.  Read the results of all three trials.  Which inference could you make about mealworms based on the results.
a)
The mealworms probably prefer the darkness of a cardboard tube.
b)
There were 6 mealworms under the light in trial 2. 
c)
Mealworms love water. 
d)
There were 36 more mealworms in the cardboard tube versus the light in trial 3.
3.
A scientist finds the skeleton of an animal that lived long ago.  He observes that the animal had broad, flat teeth and feet with hooves.  What is the best inference he could make from his observations?
a)
The animal lived in an area with few trees.
b)
The animal was a good swimmer.
c)
The animal was probably a plant eater.
d)
The animal was probably a meat eater.
4.

When scientists collect data that is measurable with numbers, we call it...

a)

qualitative

b)

quantitative

c)

hypothetical

d)

graphable

5.

Data that is descriptive, using qualities or characteristics, and your 5 senses is called...

a)

quantitative

b)

qualitative

c)

non-scientific

d)

hypothesis

6.
The graph below shows atmospheric carbon dioxide levels since the year 1880.Which of the following conclusions can be drawn from this graph
a)
 Atmospheric carbon dioxide levels are responsible for global temperature change.
b)
 Atmospheric carbon dioxide levels have been rising at about the same rate for the past century.
c)
Atmospheric carbon dioxide levels have remained the same over the past century.
d)
 Atmospheric carbon dioxide levels have been rising at an increasingly higher rate as the past century has progressed.
7.
In order to be accepted, a scientific theory must be
a)
 widely tested and supported by extensive data
b)
 based on the results of a single experiment
c)
 controversial and cause debate
d)
 in line with all previous historical ideas
8.
An experiment was carried out to determine whether drinking caffeinated soda increases pulse rate. The pulse rates of two groups of people at rest were measured. Group A was then given caffeinated soda and group B was given caffeine-free soda. One hour after drinking the soda, the pulse rates were measured. The participants in the experiment were all the same age, and they were all given the same amount of soda. The dependent variable in this experiment is the
a)
type of soda given to each group
b)
amount of soda given to each group
c)
 pulse rate of each group
d)
age of participants in each group
9.
An experiment is performed on plants to see how different liquids affect plant growth. Each plant in the experiment is given a different liquid: water, apple juice, or milk. What variables should be kept constant/controlled? 
a)
type of plant, flower pot,  soil, and amount of sunlight
b)
water, apple juice, milk
c)
only the amount of sunlight
d)
type of plant only
10.
Why do we want to test one variable at a time?
a)
Because it is hard to setup a data table with more
b)
To know what is causing the changes. This helps us understand cause and effect.
c)
It is what has always been done
11.

How do you calculate the mean of a set of data?

a)

Multiply the values together

b)

Add the values together

c)

Add the values up and divide by how many pieces of data you have

d)

Add the values up and multiply by how many pieces of data you have

12.

What 2 things must you do when drawing a graph?

a)

Use a ruler

b)

Label the x and y axis

c)

Plot data points in pen

d)

Join up the points like a dot-to-dot

13.
What pattern is evident on this line graph?
a)
Ability to do situps had no change as the days continued
b)
Ability to do situps decreased as the days continued
c)
Ability to do situps increased as the days continued
14.

Ben makes five paper helicopters with different wing lengths. He drops them the same way from a height of two meters for five trials each. He records the amount of time it takes for each helicopter to fall to the ground.

What is the independent variable?

a)

Dropping the same way

b)

Wing Length

c)

Amount of time it takes the helicopter to hit the floor

d)

Dropping from the same height

15.

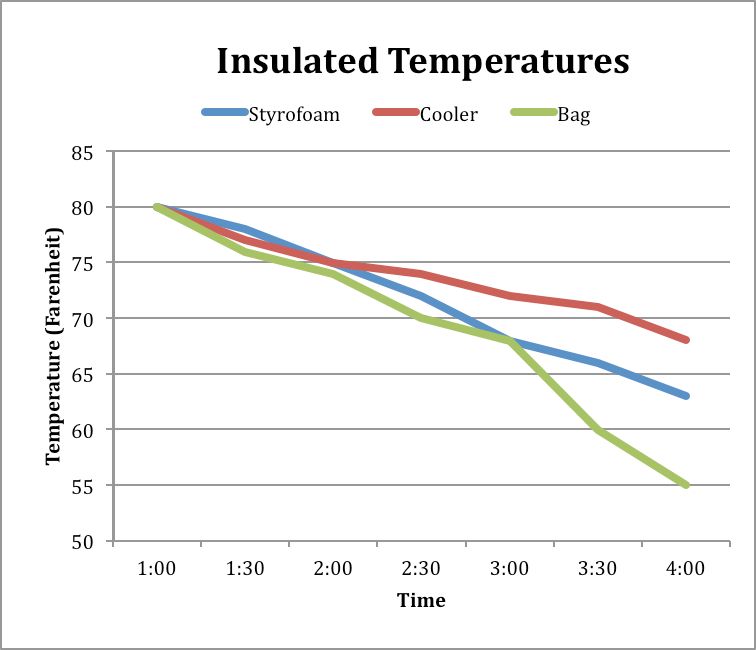
What data does this graph represent?

a)

Change in temperature of a liquid over time in 3 different containers

b)

How temperature can change the molecules in a material

c)

The phase changes of a material

d)

What type of container people use the most to store hot liquids.