
NEW
Font size
 Worksheets
Unit 5 Ecology review (optional)
Total questions: 55
Worksheet time: 1hrs 6mins
Demography is:
The study of democracy.
The study of human populations.
The study of graphs.
The study of ecosystems.
Which of the following is NOT an example of a Density Dependent Factor?
Parasitism
Natural Disasters
Predation
Competition
Population density can be best described as:
The amount of deaths that occur in a population
The amount of births that occur in a population
The amount of individuals in a given space.
The amount of available nutrients in an ecosystem
The maximum amount of organisms of a species that can be supported by an environment is:
exponential growth
logistic growth
population growth
carrying capacity
A density-independent factor happens:
depending on the number of predators hunting prey
depending on the size of the population
if there are no resources left in a habitat
regardless of the size of the population
A biotic or abiotic resource in the environment that causes population size to decrease is a
growth factor
limiting factor
carrying capacity
limiting nutrient
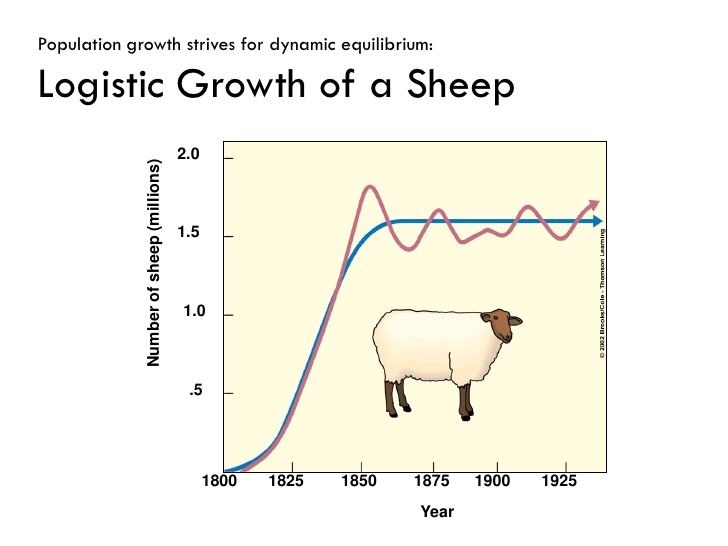

If the amount of food or resources available increases, the carrying capacity for an animal:
Stays the same
Increases
Decreases
Fluctuates
All of the meerkats that live in the same place at the same time make up a(n) ____________.
Community
Ecosystem
Population
Biosphere
All of the populations in a given area make up a ____________.
community
habitat
ecosystem
species

A massive tornado
density dependent limiting factor
density independent limiting factor

"b" represents a period in time in which this population experiences _______________ limiting factors
a lack of
many

The type of growth curve in this graph is a(n) _______________, and describes growth over ______________________.
logistic growth curve, a long period of time
exponential growth curve, a long period of time
logistic growth curve, a short period of time
exponential growth curve, a short period of time

When an organism is first introduced into an area, it usually exhibits ____________ growth which is shown by ____ on the graph.
limited, B
Exponential, B
Exponential, A
limited, A


The penguins are spread out evenly. This is an example of
uniform dispersion
random dispersion
clumped dispersion
unknown
What type of population distribution is shown by organisms that hunt in packs, gather due to resources in an area, or feed in groups for protection from predators
uniform
clumped
random
Organisms that have many offspring that either die at birth or get eaten as eggs show this type of survivorship.
Type I
Type II
Type III
Elephants
Organisms that have gestation (pregnancy) periods and usually only give birth to one offspring at a time and have strong parenting.
Type I
Type II
Type III
Fish
Humans are an example of this type of survivorship.
Type I
Type II
Type III
Type IV

What type of population growth is present in this age-structure diagram?
Exponential
Declining
Rapid Growth
Stable Growth

What type of population growth is shown in this age-structure diagram?
Rapid Growth
Industrialized Country
Declining Growth
Stable Growth
Which of the following best describes weather?
day to day conditions of the atmosphere at a place in regards to heat, dryness, sunshine, wind, rain, etc.
long-term conditions (months/years) of the atmosphere at a place in regards to heat, dryness, sunshine, wind, rain, etc.

What is the role of a producer?
Gain energy from eating other organisms
Breaking down dead stuff
Use sunlight to make food
Keep other species from overpopulating
The arrows in a food chain or web represents what?
They point to the organism that is being eaten.
They show what direction the energy is flowing between organisms.
It shows how sunlight flows within an ecosystem.
They represent how water is transferred within a habitat.
How much energy is available to be passed on to the next trophic level in an ecosystem?
700%
20%
5%
10%

In the energy pyramid here, which organisms have the most energy available?
Top Predator
Herbivores
Carnivores
Producers

What type of consumer is the shrew?
secondary consumer
primary consumer
tertiary consumer
Answer choices A&B

Which group is not represented in the food web?
producers
primary consumers
secondary consumers
decomposers
Which of these organisms would most likely be found at the bottom of a biomass pyramid?
giant squids
sand sharks
sea cucumbers
green algae
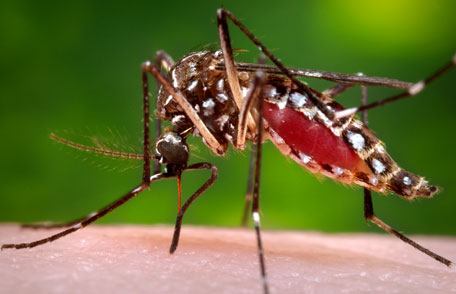
Two male deer fight over a female. This is an example of
Symbiosis
intraspecific competition
predation
interspecific competition
* Hummingbirds feed on nectar from flowers.
* Flowers are pollinated by hummingbirds as they move from flower to flower.

Predator population lags behind prey population because......
Increase in predators leads to decrease in prey
Increase in predators leads to increase in prey
Increase in predators leads to decrease in producers
Increase in producers leads to increase in prey
Primary succession takes ____________ time than secondary succession.
More
Less
Same
After an area was cleared for farmland 100 years ago, it has completely regrown large trees. This is an example of:
Evolution
Ecology
Primary Succession
Secondary Succession
primary succession
secondary succession


A toxin that breaks down slowly is introduced into the environment through the spraying of insecticides. The toxin is very lethal when an organism receives high levels of it. Which organism in the food web is in the most danger?
Grass
Rabbit
Fox
Fish
A habitat is ___________________.
the place or kind of place in which an animal or plant naturally lives.
is how plants produce their own food.
is an animal that only eats meat.
the place where only one animal lives.
A niche ________________.
is the function that an organism performs in the food web of that community.
includes everything else the organism does and needs in its environment.
is specific to each individual animal and plant.
All of the above.

