wayground logo

Free Printable Worksheets

Font size

S
M
L
XL
Worksheets

Functions and Linear Functions Unit Review

Total questions: 34

Worksheet time: 1hrs 21mins

Name
Class
Date
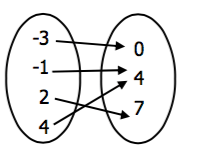
1.
a)
Function
b)
Not a Function
2.
a)

Function

b)

Not a Function

3.
a)
Function
b)
Not a Function
4.
What is the definition of function?
a)
Has inputs and outputs
b)
Every input has only ONE output
c)
Inputs have different outputs every time
d)
x-values and y-values
5.
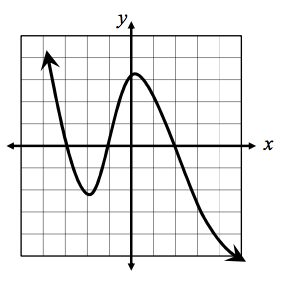
Is this graph a function or not a function? 
a)
Function 
b)
Not a Function
6.
Is the graph pictured a function?
a)
Yes
b)
No
7.
Which graph does NOT pass the vertical line test?
a)
Graph 1
b)
Graph 2
c)
Graph 3
d)
Graph 4
8.
a)
Function
b)
Not a Function
9.
Given h(x) = 5 - 9x, find h(8). 
a)
h(8) = -360
b)
h(8) = -67
10.
For the function f(x) = -3(x-1) find f(0).
a)
0
b)
-3
c)
3
d)
-1
11.

Calculate the slope.

a)

6

b)

1/6

c)

-6

d)

-1/6

12.
What is the domain of the graph?
a)
-7 ≤ x < 5
b)
-3 ≤ x < 1
c)
-3 ≤ y < 1
d)
-7 ≤ y < 5
13.
What is the range of the graph?
a)
-7 ≤ x < 5
b)
-3 ≤ x < 1
c)
-3 ≤ y < 1
d)
-7 ≤ y < 5
14.
What is the domain?
a)
all real numbers
b)
1<x<6
c)
{1,3,4,6}
d)
{-2,2,5}
15.
What is the range?
a)
{-2,2,5}
b)
{1,3,5,6}
c)
all real numbers 
d)
-2<y<5
16.
What is the domain?
a)
{-2, -1, 0, 1, 8}
b)
{3, 5, 7 , 9, 0}
c)
{-2, -1, 0, 1, 3, 5, 7, 8, 9}
d)
{-2, -1, 0, 1, 2, 3, 4, 5, 6, 7, 8, 9}
17.
What is the range?
a)
{-3, -1, 2, 4}
b)
{0, 4, 7} 
c)
{0, 4, 4, 7}
d)
{7, 4, 0}
18.
For the function {(0,1), (1,-3), (2,-4), (-4,1)}, write the domain and range.
a)
D: {1, -3, -4,}
R: {0, 1, 2, -4}
b)
D:{-4, 0, 1, 2}
R:{-4, -3, 1}
c)
D:{0, 1, 2, 3, 4}
R:{1, -3, -4}
19.
What is the range of the function? 
a)
y ≤ 2.5
b)
y > 2.5
c)
all real numbers
20.
What is the domain of the function for this situation?
a)
0<h<80
b)
0≤h≤80
c)
0≤t≤4.5
d)
0<t<4.5
21.

What is the rate of change (slope) ?

a)

50 tiles per minute

b)

1 tile per minute

c)

200 tiles per minute

d)

250 tiles per minute

22.

What is the initial value (y-intercept) ?

a)

50 tiles to start

b)

1 tile to start

c)

200 tiles to start

d)

250 tiles to start

23.

Which equation represents the graph?

a)

y= 200x +50

b)

y = 50x + 250

c)

y = x + 200

d)

y = 50x + 200

24.

What is the rate of change (slope) ?

a)

0 ft per minute

b)

400 ft per minute

c)

800 ft per minute

d)

1200 ft per minute

25.

What is the initial value (y-intercept)?

a)

0 ft to start

b)

400 ft to start

c)

800 ft to start

d)

1200 ft to start

26.

Which equation represents the table of values?

a)

y = 400

b)

y = 400x

c)

y = x + 400

d)

y = 400x + 800

27.

Which equation represents the situation?

a)

y= 5/2x + 40

b)

y = -5/2x+ 40

c)

y = 5x - 2

d)

y = -5x + 40

28.

Which equation represents the situation?

a)

y = 2/15x + 10

b)

y = 15x + 10

c)

y = 2x + 15

d)

y = 15x + 2

29.

What is the algebraic equation for this table?

a)

y = x + 3

b)

y = 3x

c)

y = x ÷ 3

d)

y = x - 3

30.

What is the algebraic equation for this table?

a)

y = 480x

b)

x = y/480

c)

x + 480 = y

d)

480 - x = y

31.

What equation represents the relationship between the variables in the table?

a)

d=10t

b)

d=t-9

c)

d=10-t

d)

d=t+10

32.
Nancy can type 50 words per minute. Look at the table below to write an equation that matches the data.
a)
m=50 + w
b)
w= 50m
c)
w= 50 + m
d)
m= 50 - w
33.
Which equation matches the table?
a)
y = 3x + 9
b)
y = x + 9 
c)
y = x + 3
d)
y = 12x - 3
34.
Name the DEPENDENT variable from the table below.
a)
minutes
b)
bubbles