
 Worksheets
Chapter 7 : Graphs of Motion
Total questions: 41
Worksheet time: 53mins
What is the formula for speed?
speed = distance x time
speed=distance / time
speed = time / distance
speed = distance + time
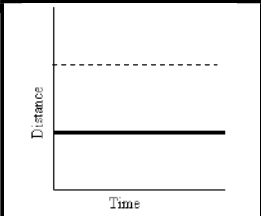
What does the solid line on this graph represent?
Constant speed
Acceleration
At rest
deceleration
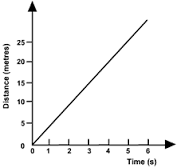
What is the line on this graph showing?
moving away from starting point at a constant speed
moving back towards the starting point at a constant speed
acceleration (getting faster)
deceleration (getting slower)
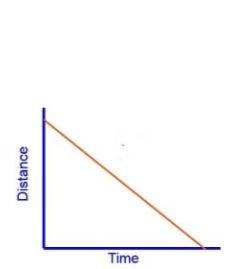
What is this line of this graph showing?
moving away from starting point at a constant speed
moving back towards the starting point at a constant speed
acceleration (getting faster)
deceleration (getting slower)


What is represented by this graph?
constant speed
not moving
speed increasing
speed increasing at a constant rate
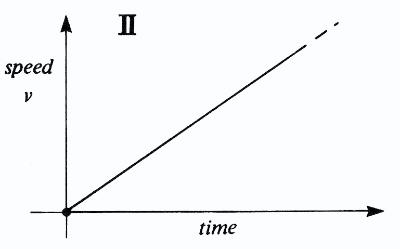
what is the motion described in the graph
all of above
constant speed
acceleration
constant position

What is happening at E?
Stationary
Accelerating
Constant speed; moving away from the starting position
Constant speed; returning to start position


What does the solid line on this graph represent?
Constant speed
Acceleration
Not moving
deceleration
What is the line on this graph showing?
moving away from starting point at a constant speed
moving back towards the starting point at a constant speed
acceleration (getting faster)
deceleration (getting slower)
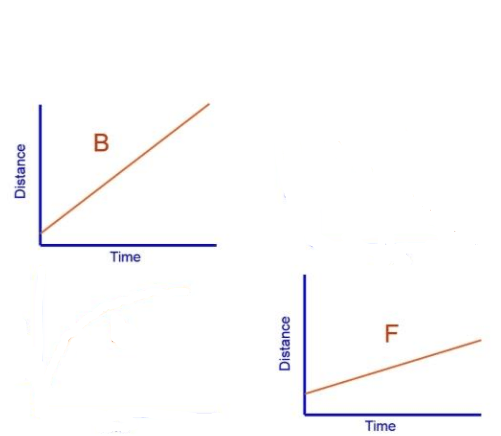

What happened during E to F point?
not moving
increasing speed at a constant rate
constant speed
acceleration

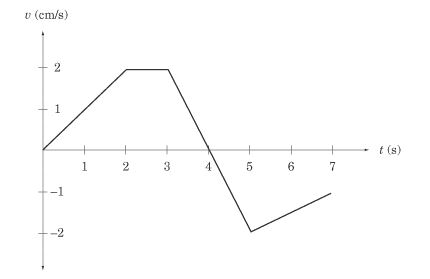
What is happening between 2 and 3 seconds?
The object is not moving.
The object is not accelerating.
The object is slowing down.
The object is speeding up.


- What is the distance covered through the second segment, which is between 50 seconds, and 70 seconds?
A person starts driving and travels 3km east to a store. The person then turns around and travels 1km west to another store. Finally, the person travels 2km west, back to the starting point. What distance has this person traveled?
0 km
3 km
5 km
6 km

The graph represents the motion of a car over 10 seconds. What is the average speed of the car during the first 4 seconds?
.4 m/s
2.5 m/s
10 m/s
40 m/s

This graph represents the motion of a cart. What is the average speed of the cart?
0.83m/s
1.17m/s
m/s
65m/s


What is the total distance traveled by the car?
60 m
20 m
0 m
80 m


Calculate the rate of change of speed, in ms-2, of the particle for the first 12 seconds.
(NO NEED TO INCLUDE UNIT)
(a)
Calculate the value of t, if the distance travelled by the particle for the last 58 seconds is 1032 m.
(NO NEED TO INCLUDE UNIT)
(a)

ABC is the speed-time graph of particle K and DE is the speed-time graph of particle L.
Calculate the distance, in m, travelled by particle K in the first 6 seconds.
(NO NEED TO INCLUDE UNIT)
(a)
ABC is the speed-time graph of particle K and DE is the speed-time graph of particle L.
At t seconds, the distances travelled by particles K and L are equal. Calculate the value of t. (Give your answer in 1 decimal place & NO NEED TO INCLUDE UNIT)
(a)

