
 Worksheets
Creating and Reading Graphs
Total questions: 38
Worksheet time: 2hrs 18mins


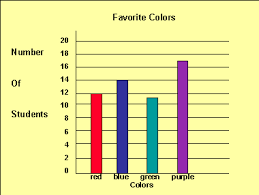

What percentage does the entire circle graph represent?
100%
50%
25%
15%


Look at the bar graph. Can you tell what the bar graph measures?
Kilowatts used by appliances per day
Average Hours appliances were used per day
Number of hours each appliance was used per day
Hours appliance used monthly


Which month had the greatest number of books read?
November
December
January
February

The graph shows the number of inches a plant grew each week.
Between which 2 weeks did the plant grow the MOST?
Week 1 and Week 2
Week 2 and Week 3
Week 3 and Week 4
Week 4 and Week 5

The pie chart shows the colours of 32 beads. How many green beads are there?
90
8
11
9
On a Cartesian Plane, the Y axis is _______?
Vertical
Horizontal
criss-cross
diagonal
How do you write a pair of coordinates?
(X,X)
(Y,X)
(X,Y)
(Y,Y)
In a pair of coordinates the first number represents which axis?
x
y
In the coordinate (4,9), which number is the y-coordinate?
4
9
neither
both
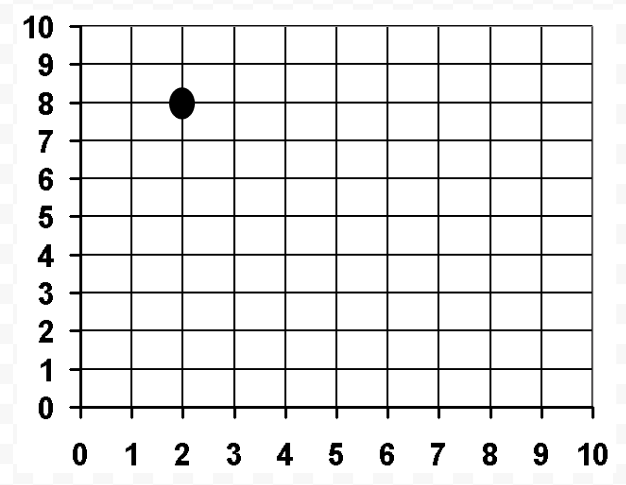
What is the coordinate of this point?
(8, 2)
(2,7)
(2,8)
(8,3)
In the coordinate point (2,7) the 2 represents
y
origin
x
point
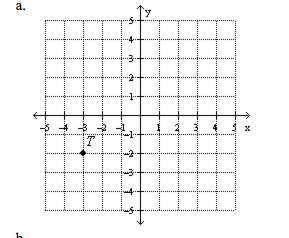
The coordinate (4, -3) is in which quadrant?
Quadrant 1
Quadrant 2
Quadrant 3
Quadrant 4
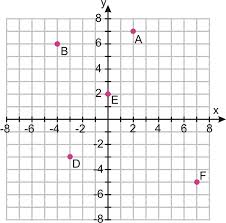
Where is point F located?
(7,-5)
(-7,5)
(7,5)
(-7,-5)
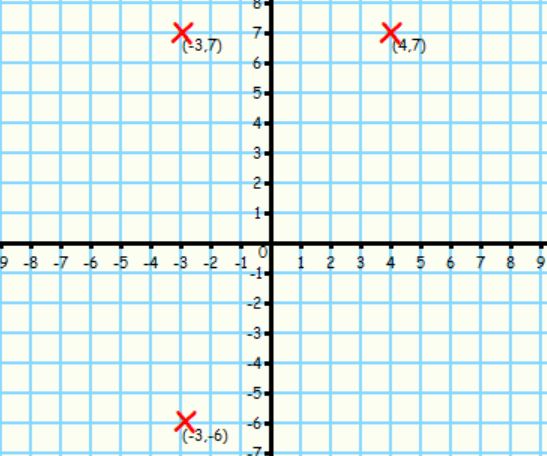
Samantha is going to draw a rectangle on this grid. Give the co-ordinates of the fourth point on her rectangle.
(4, -6)
(-6, 4)
(-4, -7)
(4, 6)
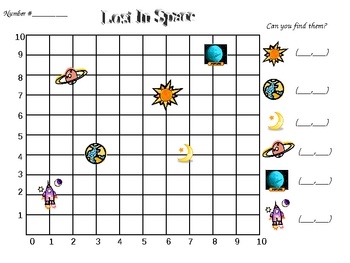
(-3, -12)

Which graph represents the data?


Which statement is the correct unit rate?
5 seconds per foot
5 feet per second
2.5 seconds per foot
2.5 feet per second
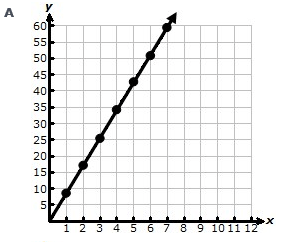
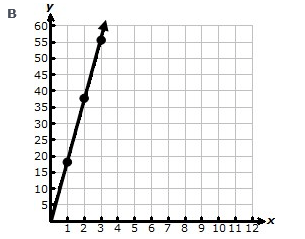
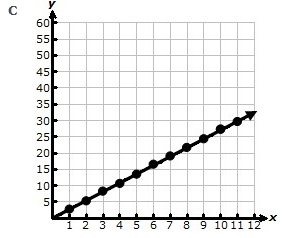
For every 125 pages Daysha reads, she earns 5 points. Which graph models this relationship?
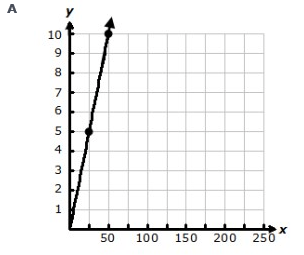
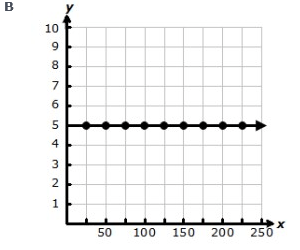
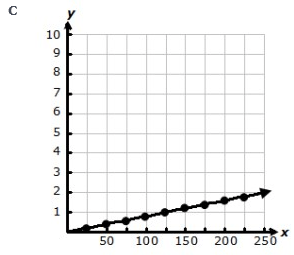

Carter receives $13.50 for every 5 boxes of chocolate he sells. Which graph shows this relationship?
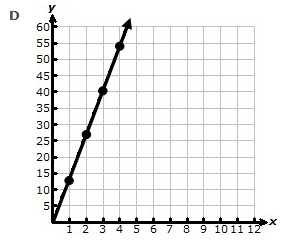

Which graph shows the same unit rate?


Which statement best describes the unit rate?
50 cm per second
300 cm per second
1 cm per second
25 cm per second

Which graph models this relationship?


Joel earns $4.50 per hour. Which graph represents this relationship?


Which statement about this graph IS NOT true?
The graph compares the ratio of the charged amount to the number of hours.
At 4 hours, the charged amount is $16.
The graph creates a straight line that increases every hour.
At 2 hours, the charged amount is greater than $5.50.

What is the unit rate, in hours worked per day, of the table?
1 hour worked a day
1 hour worked for 6 days
6 hours worked for 12 days
6 hours worked a day

What is the unit rate of the table?
$1.05
$0.15
$15.00
$0.35

How many miles per hour does the jet travel at?
840 miles per hour
420 hours per mile
420 miles per hour
840 hours per mile

